The Seven Stages of Visualizing Data

Solve your problems or get new ideas with basic brainstorming

The Seven Stages of Visualizing Data
by Salvador Galván Labrada
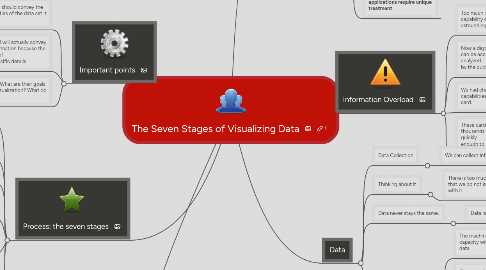
1. Important points
1.1. A visualization should convey the unique properties of the data set it represents
1.2. Less detail will actually convey more information because the inclusion of overly specific details
1.3. who is your audience? What are their goals when approaching a visualization? What do they stand to learn?
2. Process: the seven stages
2.1. Acquire: Obtain the data, whether from a file on a disk or a source over a network.
2.2. Parse: Provide some structure for the data’s meaning, and order it into categories.
2.3. Filter: Remove all but the data of interest.
2.4. Mine: Apply methods from statistics or data mining as a way to discern patterns or place the data in mathematical context.
2.5. Represent: Choose a basic visual model, such as a bar graph, list, or tree.
2.6. Refine: Improve the basic representation to make it clearer and more visually engaging.
2.7. Interact: Add methods for manipulating the data or controlling what features are visible.
3. A Combination of Many Disciplines
3.1. Requires insights from diverse fields:
3.1.1. statistics
3.1.2. data mining
3.1.3. graphic design
3.1.4. information visualization
3.2. These methods undervalue the aesthetic principles of visual design rather than embrace their strength
4. WHY+DATA+PLANNIG ?
4.1. Each set of data has particular display needs
4.2. Tools for developing graphics:
4.3. In a cookie-cutter fashion in office programs,on the Web, etc.
4.4. It´s used for specialized applications require unique treatment
5. Information Overload
5.1. Too much information but the capability of modern machines is astounding.
5.2. Now a days, Complex data sets can be accessed, explored, and analyzed by the public .
5.3. We had changes in the graphic capabilities of average machines: Graphic card.
5.4. These cards can render models with thousands of shapes, and can do so quickly enough to provide smooth, interactive animation.
6. Data
6.1. Data Collection
6.1.1. We can collect information of anyone.
6.2. Thinking about it
6.2.1. There is too much information that we do not know what to do with it.
6.3. Data never stays the same.
6.3.1. Data is a moving target, we change it.
6.4. What is the question?
6.4.1. The machines have enormously increased the capacity with which we can create and store data.
6.4.2. Disassociate the data from the original reason for collecting it.
6.4.3. It is important to focus on all the data that has been collected so far.
6.4.3.1. Why was the data collected?
6.4.3.2. what’s interesting about it?
6.4.3.3. what stories can it tell?