

1. current page
1.1. 121
2. The Problem and The Goal
2.1. Purpose of Planning
2.1.1. Why Do It?
2.1.1.1. a quest for value
2.1.1.2. Answer the question: What should we build?
2.1.1.3. Reducing RIsk
2.1.1.3.1. Discussions during estimating raise questions that expose dark corners of a project
2.1.1.4. Reducing Uncertainty
2.1.1.4.1. Over time the team is getting smarter
2.1.1.4.2. Goal is to build the right product, not the initially thought up product
2.1.1.5. Supporting Better Decision Making
2.1.1.5.1. Will the project miss the market window?
2.1.1.5.2. Will the project be profitable?
2.1.1.5.3. Are key personnel required (Architect) that may not be available?
2.1.1.5.4. How many developers do we need to make the project work in time but not cost too much to not be worth it?
2.1.1.5.5. All of these are trade off decisions that need to be made throughout the project and agile estimating can help support better answers
2.1.1.6. Establishing Trust
2.1.1.6.1. Build to reliable estimates leads to
2.1.1.7. Conveying Information
2.1.1.7.1. A plan conveys expectations
2.1.1.7.2. Estimated date of completion is not useful alone
2.1.2. What Makes a Good Plan?
2.1.2.1. One that stakeholders find sufficiently reliable that they can use it as the basis for making decisions
2.1.2.1.1. Early on
2.1.2.1.2. Later
2.1.2.1.3. Marketing can decide on when to prepare marketing materials, schedule advertising campaign, allocate resources to assist with upgrading key customers
2.1.2.2. Time estimate has to be somewhat predictive, otherwise it's not reliable to make decisions from
2.1.2.2.1. 1-2 months off still may be useful
2.1.2.2.2. 6 months off is probably not useful
2.1.3. What Makes Planning Agile?
2.1.3.1. Balances the effort and investment in planning with the knowledge that we will revise the plan through the course of the project
2.1.3.2. Focused more on the planning than on the plan
2.1.3.3. Encourages Change
2.1.3.3.1. A plan we are not only willing, but also eager to change
2.1.3.4. Results in plans that are easily changed
2.1.3.4.1. Change could be
2.1.3.5. Is spread throughout the project
2.1.3.5.1. Planning is spread evenly across the duration of a project
2.2. Why Planning Fails
2.2.1. Stats
2.2.1.1. Nearly 2/3rd of projects significantly overrun their cost estimates (Lederer and Prasad 1992)
2.2.1.2. 64% of the features included in products are rarely or never used (Johnson 2002)
2.2.1.3. The average project exceeds its schedule by 100% (Standish 2001)
2.2.2. Planning Is by Activity Rather Than Feature
2.2.2.1. We need to focus on user value/features instead of activities
2.2.2.1.1. Activities are defined as: Due database thing, due middle tier thing, test thing etc
2.2.2.2. Traditional schedule is created for review
2.2.2.2.1. Review is looking for forgotten activities rather than missing features
2.2.2.3. Activities Don't Finish Early
2.2.2.3.1. "Work expands so as to fill the time available for its completion" - Parkinson's Law
2.2.2.3.2. Gold-plating often occurs to fill the allotted time
2.2.2.3.3. Why finish early when you may be accused of padding estimates or being piled on with more work
2.2.2.4. Activities are not independent
2.2.2.4.1. Independent - duration of one activity does not influence the duration of another
2.2.2.4.2. Software is often not independent
2.2.2.5. Lateness is passed down the schedule
2.2.2.5.1. Because activities are often sequential and not feature based, lateness on the first activities means lateness is passed to all activities
2.2.2.5.2. Need to focus on features so lateness is limited to a feature and has limited impact, it shouldn't add months of delays to all features
2.2.3. Multitasking Causes Further Delays
2.2.3.1. Misconception of multitasking increasing productivity
2.2.3.1.1. driven by, if 1 task is blocked, you should have 2 others to work on
2.2.3.1.2. loading developers 100% load is like loading a highway to 100% capacity
2.2.3.2. Need to eliminate blockers, find ways to be more independent of real blockers and continue to make as much progress as possible on features
2.2.4. Features Are Not Developed by Priority
2.2.4.1. Assumptions in plans are all identified activities will be completed.
2.2.4.1.1. This means order is usually done for convenience of the team
2.2.4.2. Then at the end of the project, it's a relatively haphazard list of features that are completed
2.2.4.2.1. some features are dropped entirely when they had the most identified value
2.2.5. We Ignore Uncertainty
2.2.5.1. Users will change their minds, refine opinions or come up with new needs
2.2.5.2. Estimates on activities are seen as precision times and not the estimates they truly are
2.2.5.2.1. Not all activities will be identified up front for even the expected features delivered, we miss things
2.2.5.3. Scheduled dates are often definitive dates, leaving no room to represent the amount of uncertainty we have for that feature
2.2.5.3.1. should be focusing on range to express the uncertainty of our estimate
2.2.6. Estimates Become Commitments
2.2.6.1. Estimates are a probability
2.2.6.1.1. probability of something from 0%-100%
2.2.6.2. Commitment is not a probability
2.2.6.2.1. commitment is a date
2.2.6.3. We can't equate a date to the probability of something happening
2.2.6.3.1. Only date we can trust is the 100% but 100% may be an absurd date like 10 years away is 100%
2.2.6.3.2. Need to evaluate a variety of business factors and risks to give estimates
2.2.6.3.3. These are just estimates though, not commitment
2.3. An Agile Approach
2.3.1. An Agile Approach to Projects
2.3.1.1. Work as one team
2.3.1.1.1. No "throwing over the wall" to each other mentality
2.3.1.1.2. Product owner - gives the vision and makes decision that lead to a good return on investment
2.3.1.1.3. Customer - funding the project, or buying the software
2.3.1.1.4. Developer - programmers, testers, analysts, db engineers, usability experts, technical writers, architects, designers and so on
2.3.1.1.5. Project Manager - focus on leadership vs management
2.3.1.2. Work in short iterations
2.3.1.2.1. timeboxed - often 2 or 4 weeks
2.3.1.3. Deliver something each iteration
2.3.1.3.1. Product brought to a potentially shippable state at the end of each iteration
2.3.1.3.2. Does not require release every iteration, just potential release
2.3.1.4. Focus on business priorities
2.3.1.4.1. deliver feature sin the order specified by the product owner
2.3.1.4.2. focus on completing and delivering user-valued features rather than on completing isolated tasks
2.3.1.4.3. Uses user stories and conversation to understand and act on the real value intended for the users.
2.3.1.5. Inspect and adapt
2.3.1.5.1. incorporates all new knowledge gained in the preceding iteration and adapts accordingly
2.3.1.5.2. Plan is changed and value of the plan has increased
2.3.2. An Agile Approach to Planning
2.3.2.1. Not solely an execution of a series of steps
2.3.2.2. A rapidly and reliable generation of a flow of useful new capabilities and new knowledge
2.3.2.2.1. knowledge that is used to make the product the best that it can be
2.3.2.2.2. product knowledge
2.3.2.2.3. project knowledge is information about the team, the technologies in use, the risks and so on
2.3.2.3. Traditional project is like running a 10k
2.3.2.3.1. you know how far you have to go and you try to get there as fast as possible
2.3.2.3.2. Agile project is more like a timed race
2.3.2.4. Multiple Levels of Planning
2.3.2.4.1. Imagine planning a twenty-mile trip but can only see over four miles, plan on looking ahead and re-planning at least 5 times
2.3.2.4.2. Three distinct horizons
2.3.2.5. Conditions of Satisfaction
2.3.2.5.1. Objectives for the project
2.3.2.5.2. Sprint planning the team finds the conditions of satisfaction from the Product Owner about each story
2.3.2.5.3. All conditions sometimes cannot always be met
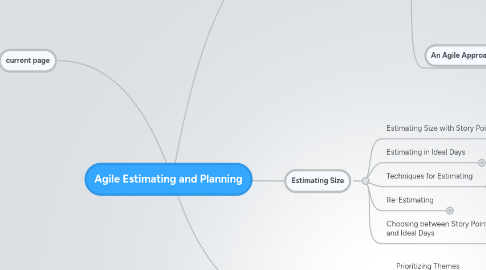
3. Estimating Size
3.1. Estimating Size with Story Points
3.1.1. Story Points Are Relative
3.1.1.1. unit of measure for expressing the overall size of a user story
3.1.1.2. raw value of points are unimporant
3.1.1.3. what matters are the relative values
3.1.1.3.1. a two should be twice as much as a story that is assigned a one
3.1.2. Velocity
3.1.2.1. measure of team's rate of progress
3.1.2.1.1. summing number of story points that the team completed during the iteration
3.1.2.2. Estimate size and derive duration
3.1.2.2.1. estimate size of backlog and derive how long to complete via dividing by the velocity = # of iterations
3.1.2.3. Corrects Estimation Errors
3.1.2.3.1. planning errors are self-correcting
3.1.2.3.2. imagine estimating painting rooms of a house based on floor plan
3.1.2.3.3. Estimating effort, not duration
3.2. Estimating in Ideal Days
3.2.1. Defined
3.2.1.1. amount of time that something takes when stripped of all peripheral activities
3.2.1.1.1. football games is 4 15min quarters - 60m ideal time
3.2.2. Elapsed time
3.2.2.1. defined
3.2.2.1.1. amount of time that passes on a clock
3.2.3. Ideal Time & Software Development
3.2.3.1. Elapsed times comes from lots of things
3.2.3.1.1. supporting current release
3.2.3.1.2. sick time
3.2.3.1.3. meetings
3.2.3.1.4. demonstrations
3.2.3.1.5. personnel issues
3.2.3.1.6. Phone calls
3.2.3.1.7. special projects
3.2.3.1.8. training
3.2.3.1.9. email
3.2.3.1.10. reviews and walk-throughs
3.2.3.1.11. interviewing candidates
3.2.3.1.12. task switching
3.2.3.1.13. bug fixing in current releases
3.2.3.1.14. management reviews
3.2.3.2. Assumptions to estimate in ideal days
3.2.3.2.1. only thing you will work on
3.2.3.2.2. everything you need will be on hand when you start
3.2.3.2.3. there will be no interruptions
3.2.3.3. assign one aggregate estimate to each user story
3.2.3.3.1. don't have, x ideal days for this person, y ideal days for this person
3.3. Techniques for Estimating
3.3.1. Be aware of diminished return on investment when estimating
3.3.1.1. accuracy goes up, then back down after too much effort in estimating
3.3.2. Estimates are Shared
3.3.2.1. Estimates are best derived collaboratively
3.3.2.1.1. We don't know who will work on a task
3.3.2.1.2. Outside view is valuable
3.3.2.2. The Estimation Scale
3.3.2.2.1. best at estimating things that fall within one order of magnitude
3.3.2.2.2. User Stories, Epics, and Themes
3.3.2.3. Deriving an Estimate
3.3.2.3.1. Expert Opinion
3.3.2.3.2. Analogy
3.3.2.3.3. Disaggregation
3.3.2.4. Planning Poker
3.3.2.4.1. Best approach according to Cohn
3.3.2.4.2. Combines all of the deriving techniques above
3.3.2.4.3. How to play
3.3.2.4.4. Right Amount of Discussion
3.3.2.4.5. Smaller Sessions
3.3.2.4.6. When to play
3.3.2.4.7. Why Planning Poker Works
3.4. Re-Estimating
3.4.1. Should only re-estimate only when we believe a story's relative size has changed
3.4.2. When Not to Re-Estimate
3.4.2.1. Estimated 4 stories at 3 thinking they could get 12 points done
3.4.2.1.1. only got 6 done
3.4.2.2. Velocity Is the Great Equalizer
3.4.2.2.1. As long as stories are consistent and relative, velocity will average out correctly, that's its purpose
3.4.2.2.2. Velocity is an ever changing number, it will compensate for in-precise release planning estimates and update the planning estimates to be more accurate with each iteration
3.4.2.3. Re-Estimating in hindsight mixes estimates with work done, and looking forward we don't know which stories will also need to be re-estimated in hindsight or are actually correct
3.4.3. When To Re-Estimate
3.4.3.1. Example
3.4.3.1.1. Team works a story with an aspect of charting
3.4.3.1.2. Charting took a lot longer than they thought
3.4.3.1.3. They should NOT re-estimate just the original, or do no re-estimating
3.4.3.1.4. They should re-estimate all stories with a charting aspect to update the relative size of those stories with a now known quantity
3.4.4. Re-Estimating Partially Completed Stories
3.4.4.1. Velocity generally should be an all or nothing mentality
3.4.4.1.1. it will be lower one sprint, but then be higher the next
3.4.4.2. If the unfinished portion of a story will not be done in the next sprint
3.4.4.2.1. Split the story into 2 and re-estimate both
3.4.4.3. Or, don't have partially complete stories, finish them all
3.5. Choosing between Story Points and Ideal Days
3.5.1. Considerations Favoring Story Points
3.5.1.1. Story points help drive cross-functional behavior
3.5.1.1.1. help teams learn to work cross-functionally
3.5.1.1.2. needs to be a single number that represents all of the work for the whole team
3.5.1.2. Story point estimates do not decay
3.5.1.2.1. Ideal days can change based on the team's experience with the technology, domain and eachother, among other factors
3.5.1.3. Story points are a pure measure of size
3.5.1.3.1. Means we can only point stories by analogy
3.5.1.3.2. Ideal days continue to think about time to completion and not analogy
3.5.1.4. Estimating in story points typically is faster
3.5.1.4.1. Ideal days means we want to understand more than relative estimates so that the time commitment is more accurate
3.5.1.4.2. Story points are more known to be relative estimates, thus the extra time estimating is not needed
3.5.1.5. My ideal days are not your ideal days
3.5.1.5.1. Team members of different experience and expertise at the same point in time can not compare the same amount of previous work because they probably did that work at different stages of their experience and expertise
3.5.2. Considerations Favoring Ideal Days
3.5.2.1. Ideal days are easier to explain outside the team
3.5.2.1.1. intuitive
3.5.2.2. Ideal days are easier to estimate at first
3.5.2.2.1. Estimating initial story points can be difficult
3.5.3. Recommendation
3.5.3.1. Story points
4. Planning for Value
4.1. Prioritizing Themes
4.1.1. Factors in Prioritization
4.1.1.1. Financial Value
4.1.1.1.1. How much money will the organization make or save
4.1.1.1.2. Estimate financial impact over a period of time - few months, quarters or possibly years
4.1.1.1.3. Can be difficult to estimate
4.1.1.1.4. Often useful to have an alternate method fo estimating value
4.1.1.2. Cost of Development and Support
4.1.1.2.1. Cost can change over time
4.1.1.2.2. Themes often seem worthwhile when viewed only in terms of the time they will take
4.1.1.3. Amount and Significance of Learning and New Knowledge Created by Developing the Features
4.1.1.3.1. Types of Knowledge
4.1.1.3.2. Reduces uncertainty
4.1.1.3.3. Early on these will be a large factor
4.1.1.4. Amount of Risk Removed by Developing the Features
4.1.1.4.1. Types of Risk
4.1.1.4.2. Suggested prioritization is to consider both risk and value
4.1.2. Combining the Four Factors
4.1.2.1. Examples
4.1.2.1.1. Infrastructure
4.1.2.1.2. User Interface Design
4.2. Financial Prioritization
4.2.1. Cohn Likes
4.2.1.1. to hold a meeting attended by as many of the individuals capable of forecasting financial value as possible
4.2.1.1.1. to perform theme valuation meeting - and complete the form
4.2.1.1.2. Individuals will probably include
4.2.2. Sources of Return
4.2.2.1. New Revenue
4.2.2.1.1. New Customers
4.2.2.2. Incremental Revenue
4.2.2.2.1. Incremental revenue from existing customers
4.2.2.2.2. Can Result From New System/Product
4.2.2.3. Retained Revenue
4.2.2.3.1. the revenue an organization will lose if the project or theme is not developed
4.2.2.3.2. Customers expect new features to continue supporting their growing/changing business
4.2.2.4. Operational Efficiencies
4.2.2.4.1. Most often related to your own inefficiencies
4.2.2.4.2. Develop tools to do our job more efficiently thus saving money long term
4.2.2.4.3. example
4.2.2.4.4. Likely Places Include
4.2.2.5. An Example: WebPayroll
4.2.2.5.1. <notes excluded>
4.2.3. Financial Measures
4.2.3.1. Time Value of Money
4.2.3.1.1. to buy a $5 burger next Tuesday might need to put $4.99 in the bank today
4.2.3.1.2. present value
4.2.3.1.3. discounting
4.2.3.1.4. opportunity cost
4.2.3.2. Net Present Value (NPV)
4.2.3.2.1. formula for evaluating a theme
4.2.3.2.2. easy to calculate and easy to understand
4.2.3.2.3. doesn't capture cash flow streams
4.2.3.3. Internal Rate of Return (IRR)
4.2.3.3.1. aka Return on Investment (ROI)
4.2.3.3.2. a measure of how quickly the money invested in a project will increase in value
4.2.3.3.3. interest rate at which the NPV of a cash flow stream is equal to 0
4.2.3.3.4. Many organizations will specify a minimum attractive rate of return (MARR)
4.2.3.3.5. Can't be used alone
4.2.3.4. Payback Period
4.2.3.4.1. definition
4.2.3.4.2. calculations and interpretations are straight forward
4.2.3.4.3. measures the amount and duration of financial risk
4.2.3.4.4. fails to take into account the time value of money
4.2.3.5. Discounted Payback Period
4.2.3.5.1. apply the appropriate discount factor to each item in cash flow stream of payback period
4.2.3.6. Comparing Returns
4.2.3.6.1. Never cut and dry
4.2.3.6.2. compare all types, compare which help other themes, overlap, which work well together etc
4.2.3.7. Next Reference
4.2.3.7.1. Steve Tockey's Return on Software: Maximizing the Return on Your Software Investment (2004)
4.3. Prioritizing Desirability
4.3.1. Kano Model of Customer Satisfaction
4.3.1.1. Threshold, or must-have, features
4.3.1.1.1. improving the performance or amount will have little impact on customer satisfaction
4.3.1.1.2. (bed, bathroom, desk of hotel)
4.3.1.2. Linear features
4.3.1.2.1. "the more, the better"
4.3.1.2.2. (wifi, size of room, number of machines in fitness center of hotel)
4.3.1.3. Exciters and delighters
4.3.1.3.1. provide great satisfaction
4.3.1.3.2. often adding a price premium to a product
4.3.1.3.3. lack of these will not cause dissatisfaction
4.3.1.4. Customer satisfaction of each
4.3.1.4.1. chart
4.3.1.4.2. threshold features
4.3.1.4.3. linear features
4.3.1.4.4. delighters
4.3.1.5. Assessing Themes
4.3.1.5.1. Customer Surveys
4.3.1.5.2. Relative Weighting