

1. Description
1.1. # of Ground Truth Instances Vs # Predicted Class Instances
2. Application
2.1. Measure the Performance of ML Models
2.1.1. Which Model?
2.1.1.1. Classifier Models
2.1.1.1.1. Naive Bayes
2.1.1.1.2. Logistic Regression
2.1.1.1.3. Decision Tree
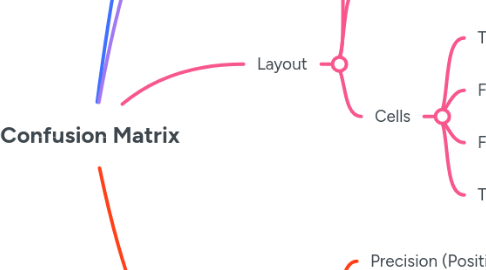
3. Layout
3.1. Columns
3.1.1. Predicted values of a given class
3.2. Rows
3.2.1. The actual values (i.e. ground truth) of a given class
3.3. Cells
3.3.1. TP (True Positives)
3.3.1.1. The number of correct predictions for the positive class
3.3.2. FP (False Positives)
3.3.2.1. Negative-class instances incorrectly identified as positive cases
3.3.2.1.1. Type 1 Error
3.3.3. FN (False Negatives)
3.3.3.1. Actual positive instances erroneously predicted negative
3.3.3.1.1. Type 2 Error
3.3.4. TN (True Negatives)
3.3.4.1. The actual negative class instances accurately predicted negative
4. Usage
4.1. Precision (Positives Predicted Value-PPV)
4.1.1. TP/(TP+FP)
4.2. Recall (Sensitivity, True Positive Rate(TPR))
4.2.1. TP/(TP+FN)
4.3. F1 Score
4.3.1. 2 * (Precision*Recall)/(Precision+Recall)
4.4. Fall Out (FPR)
4.4.1. FP/(FP+TN)
4.5. Specificity ( 1 - Fall Out)
4.5.1. TN/(FP+TN)
4.6. Negative Predicted Value (NPV)
4.6.1. TN/(TN+FN)
4.7. Accuracy
4.7.1. (TP+TN)/(TP+FP+FN+TN)