
Control Charts (Chapter 9)
by Latasha Williams
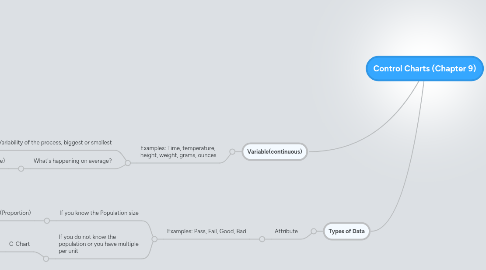
1. Variable(continuous)
1.1. Examples: Time, temperature, height, weight, grams, ounces
1.1.1. Variability of the process, biggest or smallest
1.1.1.1. R-Chart (range)
1.1.2. What's happening on average?
1.1.2.1. X Bar Chart (average)
2. Types of Data
2.1. Attribute
2.1.1. Examples: Pass, Fail, Good, Bad
2.1.1.1. If you know the Population size
2.1.1.1.1. P-Chart (Proportion)
2.1.1.2. If you do not know the population or you have multiple per unit
2.1.1.2.1. C-Chart