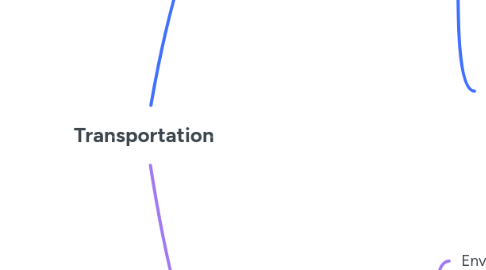
1. Public Transportation
1.1. Environmental Impact
1.1.1. Emissions
1.1.1.1. Lower CO2 emissions per passenger
1.1.2. Traffic Congestion
1.1.2.1. Reduces overall vehicle count on roads
1.1.3. Energy Consumption
1.1.3.1. More efficient use of fuel compared to personal vehicles
1.2. Convenience
1.2.1. Schedules
1.2.1.1. Fixed routes and time may limit flexibility
1.2.2. Transfer Points
1.2.2.1. Need to switch modes can add time
1.3. Accessibility
1.3.1. Coverage
1.3.1.1. Available in urban areas, less in rural
1.3.2. Facilities
1.3.2.1. Features like ramps and designation seating for disabled
1.4. Cost-Effectiveness
1.4.1. Fare Prices
1.4.1.1. Generally lower than fuel and maintaince cost
1.4.2. Public Subsidies
1.4.2.1. Many systems receive government funding, lowering costs
2. Personal Vehicles
2.1. Environmental Impact
2.1.1. Emissions
2.1.1.1. Higher per passenger compared to public transport
2.1.2. Traffic Congestion
2.1.2.1. Contributes to road congestion
2.1.3. Energy Consumption
2.1.3.1. Typically less efficient than mass transit
2.2. Convenience
2.2.1. Flexibility
2.2.1.1. Travel anytime and anywhere
2.2.2. Comfort
2.2.2.1. Personal space and amenities (music, climate control)
2.3. Accessibility
2.3.1. Availability
2.3.1.1. Necessary in areas with limited public transport
2.3.2. Parking
2.3.2.1. Need for parking spaces can be a drawback
2.4. Cost-Effectiveness
2.4.1. Initial Costs
2.4.1.1. Higher upfront costs for purchase
2.4.2. Ongoing Costs
2.4.2.1. Fuel, insurance, maintenance, and repairs can add up
