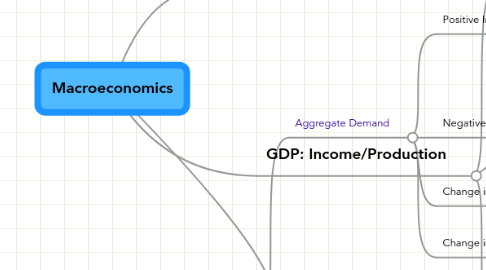
1. Aggregate Demand and Supply
1.1. Aggregate Demand
1.1.1. Positive Influence
1.1.1.1. People's Income ( I )
1.1.1.2. Gov. Expenditure ( G )
1.1.1.3. Amount of Exports ( X )
1.1.2. Negative
1.1.2.1. Price of Goods ( CPI )
1.1.2.2. Taxes ( T )
1.1.2.3. Borrowing Costs ( Interest Rate i )
1.1.3. Change in Price: Movement along the AD Curve
1.1.4. Change in nonprice: Shift
1.1.4.1. to Left: Decrease in demand
1.1.4.2. to Right: Increase in demand
1.2. Axis: Price and Real GDP
1.3. Aggregated Supply
1.3.1. Positive
1.3.1.1. Price
1.3.1.2. Technology
1.3.2. Negative
1.3.2.1. Input Price
1.3.2.2. Price of Foreign Exchange
1.3.2.3. Taxes ( T )
1.3.3. Change in Product Price: Along
1.3.4. Change in nonprice: Shift
1.3.4.1. to Left: Decrease
1.3.4.2. to Right: Increase
1.4. Self-Correction Mechanism
1.4.1. potential GDP is a straight line
2. GDP: Income/Production
2.1. Equilibrium: Supply = Demand
2.1.1. Supply = GDP
2.1.2. Demand = Total Spending
2.1.3. Demand = Consumption + Investment + Gov. Expenditure + Exports - Imports Demand = C + I + G + X - IM
2.1.4. Taxes and imports rise when people's income is higher, thus spending line is flatter, and the multiplier effect is smaller it takes a larger increase in G or a larger tax cut to significantly raise GDP
2.1.5. Equilibrium is defined by a 45 line in spending-income axises
2.2. MPC: Marginal Propensity to Consume
2.2.1. MPC is the slope of consumption function
2.2.2. Consumption function is the relationship between C and I
2.2.3. MPC = Change in C / Change in GDP
2.2.4. MPC is a fraction ( 0 < MPC < 1 )
2.3. Multiplier = Change in GDP / Change I
2.3.1. .
2.3.2. the ratio of
2.3.2.1. change in overall demand
2.3.2.2. change in one component of demand
2.3.2.3. so does it also = change GDP / Change C ?
2.3.3. .
2.3.4. MPC + MPS = 1, and
2.3.5. Multiplier = 1/(1-MPC) = 1/MPS
