Statistics survey
by Giulio Prevedello
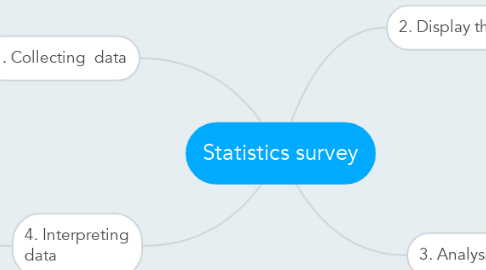
1. 1. Collecting data
1.1. direct observation
1.2. data that someone else has collected
2. 2. Display the data
2.1. Tables
2.2. Bar Charts
2.3. Pie Charts
2.4. Pictographs
2.5. Histograms
2.6. Line Graphs
3. 3. Analysing data
3.1. mode
3.2. median
3.3. mode
4. 4. Interpreting data
4.1. take a look at the data to see what they say
