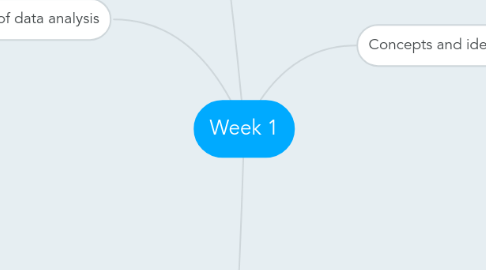
1. Scripting your analysis
1.1. Script everything
2. Structure of data analysis
2.1. Steps
2.1.1. Define a question
2.1.1.1. Narrow as much as possible
2.1.1.2. This helps remove the noise of other data
2.1.2. Define ideal data set
2.1.2.1. May depend on your goal
2.1.2.1.1. Descriptive
2.1.2.1.2. Exploratory
2.1.2.1.3. Inferential
2.1.2.1.4. Predictive
2.1.2.1.5. Causal
2.1.2.1.6. Mechanistic
2.1.3. What data you can access
2.1.3.1. Free on the web
2.1.3.2. Buy data
2.1.3.3. Might need to generate it
2.1.4. Obtain data
2.1.4.1. Try to get raw data
2.1.4.2. If got from web: record url and time accessed
2.1.5. Clean data
2.1.5.1. if it preprocessed already, understand how
2.1.5.2. understand souce of data
2.1.5.3. determine if data is good enough
2.1.5.3.1. quit
2.1.5.3.2. change data
2.1.6. Exploratory data analysis
2.1.7. Statistical prediction/modeling
2.1.7.1. Get the value of uncertancy
2.1.8. Interpret results
2.1.8.1. Use apropriate language
2.1.8.2. Give explanation
2.1.8.3. Interpret the results
2.1.9. Challenge results
2.1.9.1. All steps
2.1.9.2. Measures of uncertanty
2.1.9.3. Think of potential alternatives
2.1.10. Synthesize/write up results
2.1.10.1. Lead with questions
2.1.10.2. Don't include analysis if can
2.1.10.3. pretty figures
2.1.11. Create reproducible code
3. Organizing analysis
3.1. Data
3.1.1. Raw data
3.1.1.1. If downloaded from web - add date in README
3.1.2. Processed data
3.1.2.1. Should be named so it is easy to understand which script generated the data
3.2. Figures
3.2.1. Exploratory figures
3.2.2. Final figures
3.3. R code
3.3.1. Raw / unused scripts
3.3.2. Finl scripts
3.3.3. R markdown files
3.4. Text
3.4.1. README
3.4.1.1. Should contain step-by-step instructions for analysis
3.4.2. Article
3.4.2.1. Title
3.4.2.2. Intro
3.4.2.3. Used methods
3.4.2.4. results
3.4.2.5. Conclusions
4. Concepts and ideas
4.1. Replicate your results by different people
4.1.1. Cannot be replicated due to:
4.1.1.1. No time
4.1.1.2. No money
4.1.1.3. Unique
4.1.2. Make code available to everyone
4.2. Validation of data analysis
4.3. Research pipeline
4.3.1. Article
4.3.1.1. Author goes left to right
4.3.1.2. Reader goes right to left
4.4. What needed
4.4.1. Data should be available
4.4.2. Avilable code
4.4.3. Documentation of code and data
4.4.4. Standard ways of distribution
4.5. Players
4.5.1. Author
4.5.2. Readers
4.6. Literate Programming
4.6.1. Article
4.6.1.1. Text
4.6.1.2. Code
4.6.2. Presentation code
4.6.3. General concept
4.6.3.1. Documentation language
4.6.3.2. Programming language
4.6.4. Types
4.6.4.1. Sweave
4.6.4.1.1. uses Latex
4.6.4.1.2. Lacks features: caching, multiple plots
4.6.4.1.3. Not well udapted
4.6.4.2. knitr
4.6.4.2.1. uses R
