1. The Mass Media
1.1. consistent liberals
1.1.1. Have a wide array of news sources
1.1.1.1. 15% CNN
1.1.1.2. 12% MSNBC
1.1.1.3. 15% NPR
1.1.1.4. 10% NYT
1.2. consistent conservatives
1.2.1. Have a more concentrated range of news sources
1.2.1.1. 88% trust fox news
1.2.1.2. 47% cite fox news as their main source of news
2. Race and Ethnicity
2.1. hispanic
2.1.1. immigration
2.1.1.1. 12% believe that republican congress will have a better approach
2.1.1.2. 47% believe that neither Obama nor the republican congress will have a better approach
2.1.1.3. 36% believe Obama will have a better approach
2.2. white
2.2.1. immigration
2.2.1.1. 42% believe republican congress will have a better approach
2.2.1.2. 24% believe Obama will have a better approach
2.2.1.3. 30% believe neither republican congress nor Obama will have a better approach
2.3. black
2.3.1. immigration
2.3.1.1. 17% believe the republican congress will have a better approach
2.3.1.2. 43% believe Obama will have a better approach
2.3.1.3. 35% believe neither the republican congress nor Obama will have a better approach
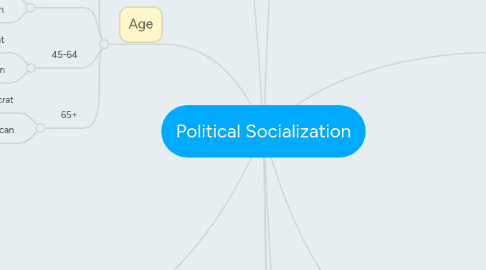
3. Age
3.1. 18-29
3.1.1. 54% voted democrat
3.1.2. 43% voted republican
3.2. 30-44
3.2.1. 50% voted democrat
3.2.2. 48% voted republican
3.3. 45-64
3.3.1. 45% voted democrat
3.3.2. 53% voted republican
3.4. 65+
3.4.1. 41% voted democrat
3.4.2. 57% voted republican
4. Region
4.1. early voters
4.1.1. midwest
4.1.1.1. 19% voters
4.1.2. northeast
4.1.2.1. 8% of voters
4.1.3. west
4.1.3.1. 51% of voters
4.1.4. south
4.1.4.1. 33% of voters
4.2. voted on election day
4.2.1. northeast
4.2.1.1. 92% of voters
4.2.2. midwest
4.2.2.1. 81% of
4.2.3. south
4.2.3.1. 67% of voters
4.2.4. west
4.2.4.1. 49% of voters
5. Family
5.1. families with an annual income of $30,000 or less
5.1.1. 35% voted republican
5.1.2. 55% voted democrat
5.2. families with an annual income of $30,000 to $74,999
5.2.1. 51% voted republican
5.2.2. 41% voted democrat
5.3. families with an annual income of $75,000+
5.3.1. 49% voted republican
5.3.2. 45% voted democrat
6. School and Peers
6.1. school
6.1.1. Post Graduate education
6.1.1.1. 39% voted republican
6.1.1.2. 58% voted democrat
6.1.2. college graduates
6.1.2.1. 51% voted republican
6.1.2.2. 41% voted democrat
6.1.3. some college
6.1.3.1. 48% voted republican
6.1.3.2. 44% voted democrat
6.1.4. High School or less
6.1.4.1. 48% voted republican
6.1.4.2. 40% voted democrat
7. Religion
7.1. protestant
7.1.1. 37% voted democrat
7.1.2. 61% voted republican
7.2. catholic
7.2.1. 45% voted democrat
7.2.2. 54% voted republican
7.3. Jewish
7.3.1. 66% voted democrat
7.3.2. 33% voted republican
7.4. None
7.4.1. 69% voted democrat
7.4.2. 29% voted republican
8. Gender
8.1. Male
8.1.1. 41% voted democrat
8.1.2. 57% voted republican
8.2. female
8.2.1. 51% voted democrat
8.2.2. 47% voted republican
9. Impact of Events
9.1. Benghazi
9.1.1. 37% of people believe the Obama administration was honest
9.1.1.1. 15% were republican
9.1.1.2. 62% were democrats
9.1.1.3. 30% were independent
9.1.2. 40% of people believe the Obama administration was dishonest
9.1.2.1. 70% were republican
9.1.2.2. 16% were democrats
9.1.2.3. 30% were independent
9.1.3. 23% of people don't know if the Obama administration was honest
9.1.3.1. 15% were republican
9.1.3.2. 22% democrats
9.1.3.3. 22% didn't know
9.1.4. 36% of people believe republicans have gone too far in hearings
9.1.4.1. 8% were republicans
9.1.4.2. 60% were democrats
9.1.4.3. 34% were independent
9.1.5. 34% of people believe republicans handled the hearings properly
9.1.5.1. 65% were republican
9.1.5.2. 15% were democrat
9.1.5.3. 35% were independent
9.1.6. 30% of people don't know how the republicans handled the hearings
9.1.6.1. 27% were republican
9.1.6.2. 25% were democrat
9.1.6.3. 31% were independent
