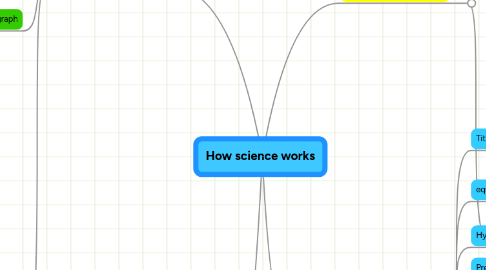
1. Data and analysis
1.1. Primary data
1.1.1. Results that you have collected in an experiment
1.2. Table of results
1.2.1. Clear headings describing the variables
1.2.1.1. The independent and dependent variables should be used to work out the headings
1.2.2. Units
1.2.2.1. Length
1.2.2.1.1. mm, cm, m, km, Miles
1.2.2.2. temperature
1.2.2.2.1. degrees Celcius, Centigrade
1.2.2.3. volume
1.2.2.3.1. cm3, mls, dm3
1.2.2.4. mass
1.2.2.4.1. g, kg
1.2.3. Use a ruler and a pencil
1.2.4. record to 2 decimal places
1.2.4.1. 1.00
1.2.5. calculate the average
1.2.5.1. add up the results. Press = then divide by how many results you have
1.3. Type of graph
1.3.1. Bar chart
1.3.2. Pie chart
1.3.3. Scatter graph
1.3.4. New node
1.4. Drawing a good line graph
1.4.1. Title
1.4.2. Axis drawn with a pencil and a ruler
1.4.3. Suitable scale
1.4.4. x axis labelled with independent variable
1.4.5. y axis labelled with dependent variable
1.4.6. units on both axis
1.4.7. Points carefully plotted with a pencil
1.4.8. if it looks like the plot should be a straight line - use a ruler
1.4.9. if it looks like the plot should be a curve DON'T use a ruler
1.4.10. draw a line of best fit
1.5. Describing a pattern
1.5.1. keywords
1.5.1.1. Straight
1.5.1.2. curve
1.5.1.3. steep
1.5.1.4. gradual
1.5.1.5. increase
1.5.1.6. decrease
1.5.1.7. origin
1.5.1.8. peak
1.5.1.9. constant
1.5.1.10. level
1.5.2. Use the axis on the graph to desribe the relationship
2. Conclusions, evaluating and secondary evidence
2.1. Conclusions
2.1.1. Making a judgement about what you have found out
2.1.1.1. Looking at a prediction to see if it was true or false
2.1.2. Using some scientific knowledge
2.1.2.1. using secondary evidence to back up your primary evidence
2.2. evaluating
2.2.1. How accurate was your experiment?
2.2.2. Is it reliable?
2.2.3. Were there possible errors made when using the equipment?
2.2.4. Have you got any anomalous results?
2.3. using secondary evidence
2.3.1. What is secondary evidence?
2.3.1.1. Information provided by other people
2.3.2. examples of types
2.3.2.1. Television
2.3.2.2. internet
2.3.2.3. book/leaflet/report
2.3.3. How can I use other peoples work legally?
2.3.3.1. reference where it came from
2.3.3.2. write a bibliography
3. Hazards and risks
3.1. What is a hazard?
3.1.1. Something that could cause you harm
3.2. What is risk?
3.2.1. The likelyhood or chance of some thing happening
3.3. Hazard symbols
3.3.1. flammable
3.3.2. caution
3.3.3. explosive
3.3.4. corrosive
3.3.5. toxic
3.3.6. Harmful
3.3.7. irritant
3.3.8. dangerous to the environment
3.3.9. biohazard
3.3.10. Radioactive
3.3.11. electrical
3.3.12. oxidising
3.4. Lab rules
3.4.1. Don't run
3.4.2. report breakages and spillages
3.4.3. no eating or drinking
3.4.4. no shouting
4. Planning an experiment
4.1. Title
4.1.1. Clearly explains the independent and dependent variables
4.2. equipment
4.2.1. A list of what you will be using
4.2.2. precision
4.3. Hypothesis
4.3.1. The question or theory you are testing
4.4. Prediction
4.4.1. What you think will happen
4.5. Variables
4.5.1. independent
4.5.1.1. what you control
4.5.2. dependent
4.5.2.1. what you measure
4.5.3. control
4.5.3.1. what you keep the same to make it a fair test
4.6. Diagram
4.6.1. 2D
4.6.2. use a pencil and a ruler
4.6.3. Label
4.7. Plan
4.7.1. A step by step guide explaining what you will do
