
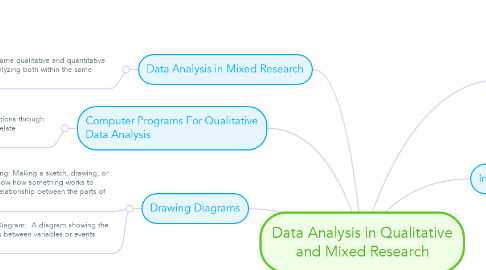
Data Analysis in Qualitative and Mixed Research
por David Páez
1. Segmenting Coding Developing Category Systems
1.1. Segmenting: Dividing data into meaningful analytical units.
1.2. Coding: Marking Segments of data with symbols, descriptive words , or category names.
1.3. Master list; A list of all the codes used in a research study.
2. Co-Cocurring Facesheet Codes
2.1. Co-occurring codes: Codes that overlap partially or completely.
2.2. Facesheet codes; Codes that apply a complete document or case.
3. Enumeration
3.1. Process of quantifying Data.
4. Creating Hierarchical Category Systems
4.1. Creation and identification of the data by studying the building blocks that appear in data.
5. Identifying Relationships among Categories.
5.1. Search many and different kinds of relations or connections between things, including not limited variables.
6. Drawing Diagrams
6.1. Diagramming: Making a sketch, drawing, or outline to how how something works to clarify the relationship between the parts of a whole.
6.2. Network Diagram: A diagram showing the direct links between variables or events over time.
7. Computer Programs For Qualitative Data Analysis
7.1. Creating logical combinations through software which helps to relate qualitative data.
8. Data Analysis in Mixed Research
8.1. Collecting dame qualitative and quantitative data but analyzing both within the same framework
8.1.1. Mixed Data Analysis: Same procedures used in the data of a research study,
9. It is:
9.1. "Creating meaning from raw data".
9.2. Develop a deeper understanding of the research topic.
10. Interim Anaylsis
10.1. Cyclical process of collecting and analyzing data during a single study.
10.2. Its process: Data collection-Data entry & Storage-Segmenting, coding and developing category systems-Identifying relationships-Constructing diagrams, tables, matrices, and graphs-Corroborating and validating results..
11. Memoing
11.1. Recording reflective notes about what you are learning from data.
11.2. Writing memos.
11.3. Includes Notes from everything.
11.4. Conclusive if it is written at the end of the project.
12. Analysis of Visual Data
12.1. A picture is worth a thousand words
12.1.1. Photo Interviewing: Analysis is done by the participant who examines and "analyzes" a set of visual images.
12.1.2. Semiotic visual Analysis: The identification and interpretation of symbolic meaning of visual data.
12.1.3. Visual content Analysis: The identification and counting of events characteristics or phenomena in visual data.
13. Democracia por Giovanni Sartori Hecho por: Jesús David Páez Molina
14. Data Entry and Storage
14.1. Transcribe most of the data.
14.1.1. Transcription transforming qualitative data into typed text.