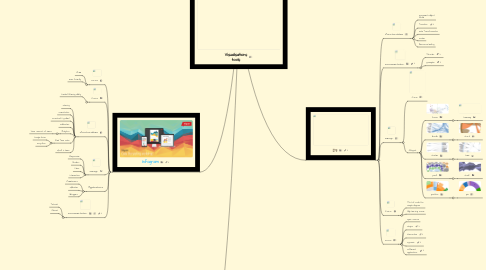
1. Infogram
1.1. Pros
1.1.1. Free
1.1.2. User friendly
1.2. Cons
1.2.1. Limited filtering ability
1.3. Functionalities
1.3.1. Sharing
1.3.2. Presintation
1.3.3. Download & Embed
1.3.4. Publischen
1.3.5. Analytics
1.3.5.1. View amount of views
1.3.6. Real-Time Data
1.3.6.1. Google drive
1.3.6.2. Drop box
1.3.7. Work in team
1.4. Design
1.4.1. Responsive
1.4.2. Modern
1.4.3. Clear
1.4.4. Interactive
1.5. Applications
1.5.1. Freelancers
1.5.2. Websites
1.5.3. Bloggers
1.6. Documentation
1.6.1. Tutorial
1.6.2. Manual
2. R
2.1. Pros
2.1.1. Quick
2.1.2. Open source
2.1.3. Flexible
2.1.4. VCS
2.1.5. Can be used for different applications
2.1.5.1. Data analisys
2.1.5.2. (Presentation)
2.2. Cons
2.2.1. High learning curve
2.2.2. Debugging is difficult
2.3. Design
2.3.1. Simple
2.3.2. Clear
2.4. Documentation
2.4.1. help() function
3. The End
3.1. Check out our mindmaps
3.2. http://tinyurl.com/ebola-kdg
3.3. Questions
4. D3
4.1. Functionalities
4.1.1. Document Object Model
4.1.2. Transition
4.1.3. Data Transformation
4.1.4. Scales
4.1.5. Resource laading
4.2. Documentation
4.2.1. Tutorials
4.2.2. Examples
4.3. Design
4.3.1. CSS
4.3.2. d3.layout
4.3.2.1. force
4.3.2.1.1. treemap
4.3.2.2. bundle
4.3.2.2.1. chord
4.3.2.3. cluster
4.3.2.3.1. tree
4.3.2.4. pack
4.3.2.4.1. stack
4.3.2.5. partition
4.3.2.5.1. pie
4.4. Cons
4.4.1. A lot of code for simple diagram
4.4.2. High learning curve
4.5. Pros
4.5.1. Open source
4.5.2. Plugins
4.5.3. Interactive
4.5.4. Dynamic
4.5.5. Different applications
