Grade 4 Data Management
by Ilana Ross
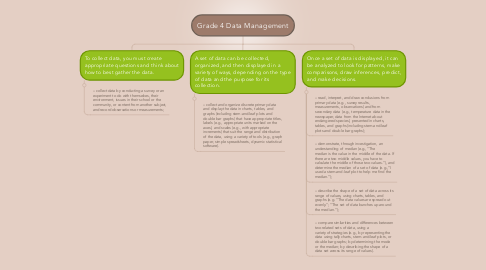
1. To collect data, you must create appropriate questions and think about how to best gather the data.
1.1. – collect data by conducting a survey or an experiment to do with themselves, their environment, issues in their school or the community, or content from another subject, and record observations or measurements;
2. A set of data can be collected, organized, and then displayed in a variety of ways, depending on the type of data and the purpose for its collection.
2.1. – collect and organize discrete primary data and display the data in charts, tables, and graphs (including stem-and-leaf plots and double bar graphs) that have appropriate titles, labels (e.g., appropriate units marked on the axes), and scales (e.g., with appropriate increments) that suit the range and distribution of the data, using a variety of tools (e.g., graph paper, simple spreadsheets, dynamic statistical software).
3. Once a set of data is displayed, it can be analyzed to look for patterns, make comparisons, draw inferences, predict, and make decisions.
3.1. – read, interpret, and draw conclusions from primary data (e.g., survey results, measurements, observations) and from secondary data (e.g., temperature data in the newspaper, data from the Internet about endangered species), presented in charts, tables, and graphs (including stem-and-leaf plots and double bar graphs);
3.2. – demonstrate, through investigation, an understanding of median (e.g.,“The median is the value in the middle of the data. If there are two middle values, you have to calculate the middle of those two values.”), and determine the median of a set of data (e.g.,“I used a stem-and-leaf plot to help me find the median.”);
3.3. – describe the shape of a set of data across its range of values, using charts, tables, and graphs (e.g. “The data values are spread out evenly.”; “The set of data bunches up around the median.”);
3.4. – compare similarities and differences between two related sets of data, using a variety of strategies (e.g., by representing the data using tally charts, stem-and-leaf plots, or double bar graphs; by determining the mode or the median; by describing the shape of a data set across its range of values).
