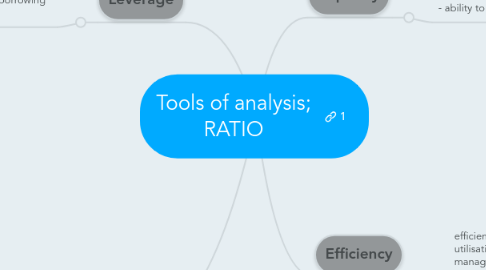
1. Leverage
1.1. extent of firm's activities financed by borrowing (externally)
1.1.1. Debt Ratio
1.1.1.1. tells proportion of assets financed with debts
1.1.1.1.1. Eg. Ratio of 0.55 = 55% of total A financed by borrowing (L)
1.1.1.1.2. HIgher Debt ratio % = higher riskiness of co.
1.1.2. Times-Interest-Earned Ratio (interest cover)
1.1.2.1. no. of times operating income can cover interest expense
1.1.2.1.1. Eg. Ratio of 4.24 times = recurring (periodical) income is 4.24 times of interest payments
1.1.2.1.2. higher ratio -- more profit $$ to cover interest payment
1.1.2.2. no. of times recurring income thats avail to cover interest payments
2. Profitability
2.1. - allow investors, creditors, managers to evaluate the extent of invested funds are that are being used efficiently - earning ability of company
2.1.1. Net-Profit Margin
2.1.1.1. Eg. ratio of 0.06= every $1 net sales generates $0.06 of net profit (or NP margin =6%)
2.1.1.2. high margin-- more net sales $ providing profit to biz and fewer NS $ absorbed by expenses
2.1.2. Return on Total Assets
2.1.2.1. company's success in using A to earn profit
2.1.2.1.1. Eg. ratio of 13% = every $1 asset ->profit of $0.13
2.1.3. Return on Ordinary Shareholders' Equity
2.1.3.1. shows r/s between NP and s/o investment in co.
2.1.3.1.1. Eg. Ratio of 13% = every $1 invested by ordinary s/o earns NP of $0.13
2.1.4. Earnings per Share (EPS)
2.1.4.1. amt of net income per share of co.'s ordinary shares issued
2.1.4.2. measures NP attributable to one ordinary share
2.1.5. Price-Earnings (PE) Ratio
2.1.5.1. ratio of market price of a share to company's earnings (indicates stock values)
2.1.5.2. high PE = invetors willing to pay more to buy shares of co. they think has good prospects
3. LIquidity
3.1. - ability of company to meet current obligations - ability to pay off debts
3.1.1. Current Ratio
3.1.1.1. ability to pay its debts
3.1.1.1.1. Eg. Ratio of 1.85 = every $1 firm owes, it has $1.85 of CA that can be converted into cash to pay its debt
3.1.1.1.2. Desirable ratio = 2 --> more CA (than CL) that’s convertible into cash to pay off debts (depending on industry of Co.) the higher the better
3.1.2. Quick/Acid-Test Ratio
3.1.2.1. indicates if entity can pay all CL if they come due immediately
3.1.2.1.1. Eg. Ratio of 1.01 = every $1 of short-term debt is backed by $1.01 of cash/near-cash assets
3.1.2.2. ability to pay short-term debts
3.1.2.3. better measure(> current ratio) for liquidity
4. Efficiency
4.1. efficiency of firm in utilisation & management of resources/assets
4.1.1. AR/Debtors Turnover Ratio
4.1.1.1. ability to collect cash frm credit customers
4.1.1.2. Low ratio = 1) Cash tied up in debtors 2) Higher risk of bad debts
4.1.1.2.1. Eg. Ratio of 7.53 = during the yr, AR collected on average of 7.53 TIMES
4.1.1.2.2. Debtor collection period (365/AR ratio) eg. 48 days -- Average no. of dats between sale of product and receipt of payment = 48 days
4.1.2. Inventory Turnover Ratio
4.1.2.1. - how fast able to sell off inventory - no. of times company sells average level of inventory during yr
4.1.2.1.1. Eg. Ratio of 4.54 times = during the yr, company sells inventory on average of 4.54 times
4.1.2.1.2. Stock holding period/No. of days it takes to sells stocks = 365/inventory turnover

