

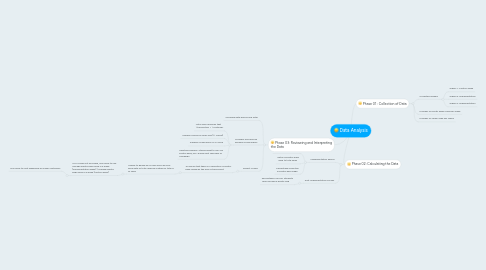
1. Phase 02: Calculating the Data
1.1. Implementation Period
1.1.1. Number of Plastic Bags Used per Week
1.1.2. Ratio of plastic bags used to total sales
1.1.3. Percentage reduction in plastic bag usage
1.2. Post Implementation Survey
1.2.1. Percentage of RVRC students who refused a plastic bag
2. Phase 03: Reviewing and Interpreting the Data
2.1. Compare data before and after
2.2. Consider and remove possible confounders
2.2.1. Total sales assumes that 1 transaction = 1 customer
2.2.2. Subway closes on Open Day (11 March)
2.2.3. Subway closed early on 7 March
2.2.4. Habitual problem; Staffs forget to ask "No plastic bags, ok?" during first few days of campaign
2.3. Project Scope
2.3.1. To ensure that there is a reduction of plastic bags usage by the end of the project
2.3.1.1. Unable to gauge as of now since we only have data of total revenue instead of total # of sales
2.3.1.1.1. If # of sales not provided, may have to use average plastic bags used in a week (implementation week) / average plastic bags used in a week (control week)
3. Phase 01 : Collection of Data
3.1. Collected Weekly
3.1.1. WEEK 7: Control Week
3.1.2. WEEK 8: Implementation
3.1.3. WEEK 9: Implementation