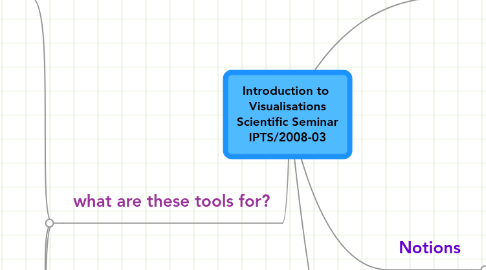
1. what are these tools for?
1.1. Mapping physical territories
1.1.1. geopolitical (borders, ressources, environmental measuring..)
1.1.1.1. JRC maps
1.1.1.2. darfur crisis
1.1.2. psycho-geography
1.1.2.1. map of istambul
1.1.2.2. map bcn
1.1.2.3. cartografía estrecho
1.1.2.4. common census map
1.1.3. GIS/GPS
1.1.3.1. Mapserver
1.1.3.2. googlemaps
1.1.3.3. inforain
1.1.4. Wikimaps
1.1.4.1. open street map
1.1.4.2. tunisian prison map
1.1.4.3. history timeline
1.2. Mapping digital territories
1.2.1. > Beginning: explore, derive, open entrance of data, serendipity
1.2.1.1. Visualizing / data mining
1.2.1.1.1. information retrieval : search engines
1.2.1.1.2. information flows
1.2.1.1.3. relations
1.2.2. > development: build corpus data/ shape methodology/experiment relations
1.2.2.1. identify/ build/explore data corpus
1.2.2.1.1. Tics & Migrations/ Study on SC and IEM
1.2.2.1.2. linkology/Anemone
1.2.2.1.3. digg lab
1.2.2.1.4. etc/group
1.2.3. > finalize: spread, present data
1.2.3.1. display
1.2.3.1.1. Many eyes
1.2.3.1.2. area
1.2.3.1.3. silobreaker
1.2.3.1.4. NYC global talk
1.3. Creating Inmersive environments
1.3.1. distance meeting/learning
1.3.1.1. Second life Grid education
1.3.1.1.1. slurl
1.3.2. creation of experiments on social conditions
1.3.3. gaming
1.3.3.1. MUD
1.3.3.1.1. Alphaworld
1.3.3.2. Video Games
1.3.3.2.1. Warcraft
2. Notions
2.1. Visualisations
2.1.1. from representation to visualisation
2.1.1.1. The power of external representations
2.1.1.2. additive or substitutive codes
2.1.2. Periodic Table of Visalistation Methods
3. guidelines to select them
3.1. Tufte Principles of graphic excellence
3.1.1. GE is a matter of substance statistic and design
3.1.2. Communicate complexity with clarity, precision and efficiency
3.1.3. the greatest number of ideas in the shortest time with the least ink in the smallest space
3.1.4. is nearly always multivariate.
3.1.5. requires telling the truth about the data
3.1.6. New node
3.2. BcnVisualisationsTeam
3.2.1. issues to consider
4. Sources
4.1. Open Lists
4.2. RSS feeds
4.2.1. infoaesthetics
4.3. Tags tracking
4.4. Websites, blogs
4.4.1. the map room
4.4.2. visual complexity
4.4.3. el germinador
4.4.4. atlas of cyberspace
4.5. Groups/ Experiments
4.6. Courses
4.6.1. MIT social visualisation course
4.6.2. presence space and place resources
4.6.3. Berkeley Info Vis course
