
What is a Fishbone Diagram?
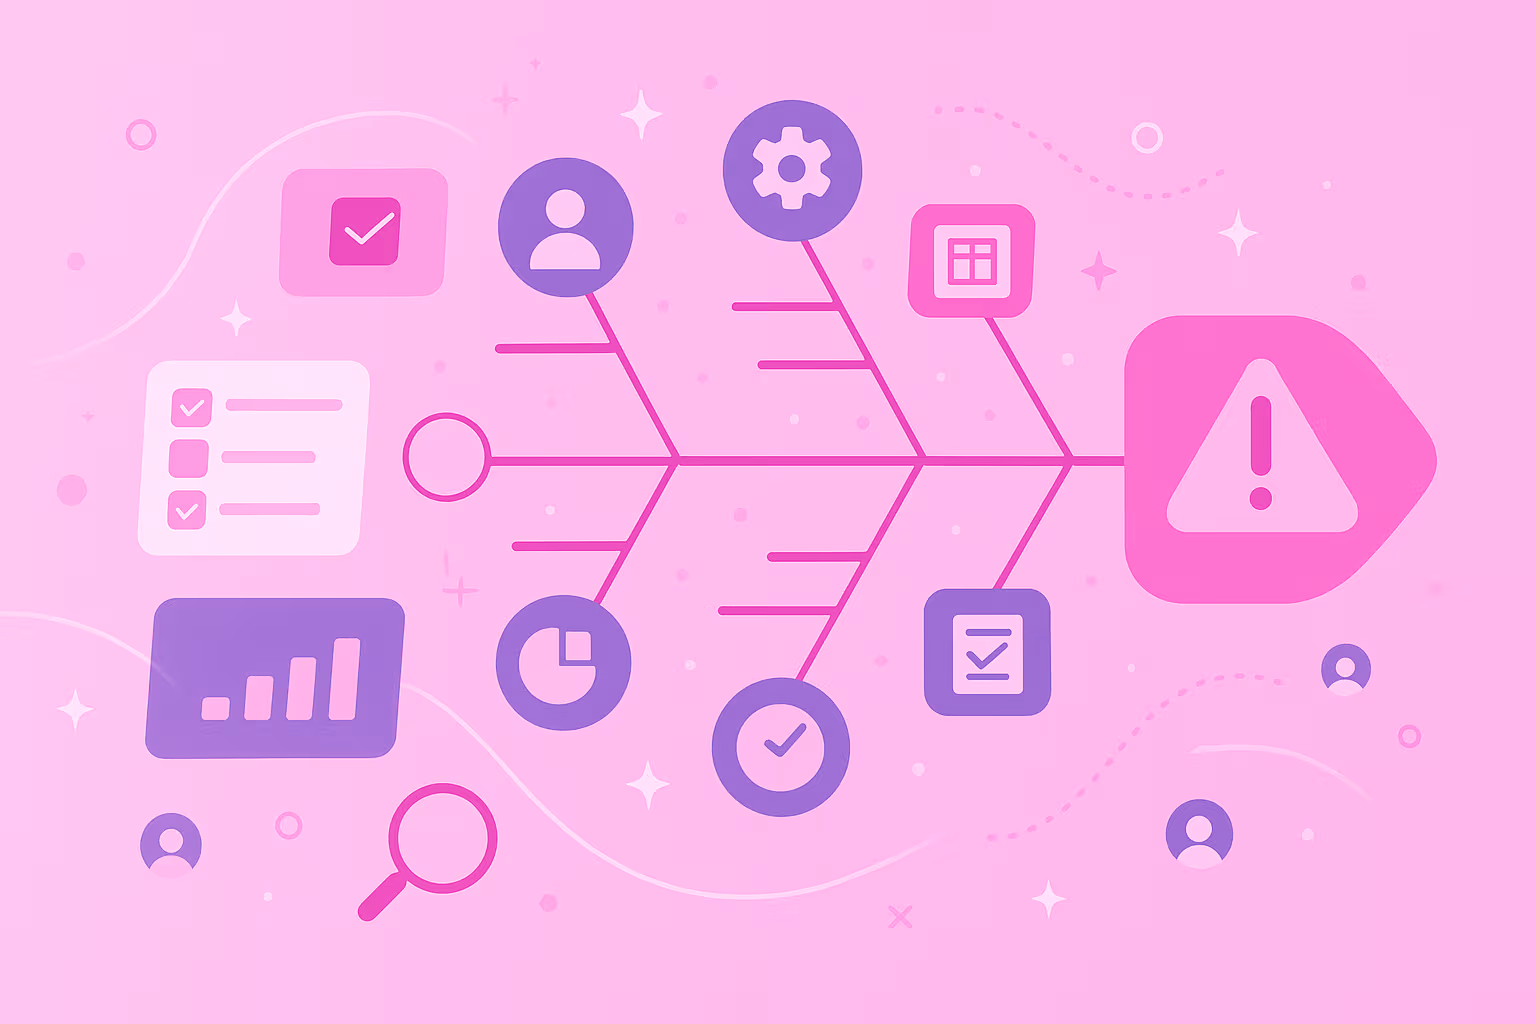
A Fishbone Diagram is a visual tool that helps you find the possible causes of a problem. You write the problem on the right side of the page, then draw lines branching out to show what might be causing it — kind of like the skeleton of a fish.
You may also hear it called an Ishikawa diagram or a cause-and-effect diagram. It was created by Japanese quality expert Kaoru Ishikawa in the 1960s, and all three names point to the same tool.
Here's how the structure works:
The "head": the problem or effect you want to understand sits on the right side of the diagram.
The "spine": a horizontal line runs across the page toward the head.
The "bones": major cause categories branch off the spine, and smaller subcauses branch off each one.
A Fishbone Diagram is different from a regular mind map. A mind map is open-ended and helps you explore ideas in any direction. A Fishbone Diagram has one job: to trace a single problem back to its root causes in a structured way.
Why use a Fishbone Diagram for root cause analysis?
When something goes wrong at work, it's tempting to fix the first cause you spot. But that often treats the symptom, not the root cause — and the problem recurs. A fishbone diagram helps you slow down and look at the full picture before you act.
Here's what you get from using one:
Organized thinking: the diagram groups causes into categories, so patterns and connections are easier to see than in a messy list
Symptoms vs. root causes: mapping contributing factors visually helps you tell surface-level issues apart from the deeper causes driving them
Better team conversations: the visual format invites input from different people and builds shared understanding fast
A clear next step: once causes are mapped, you know exactly where to gather data and what to investigate
Teams across manufacturing, healthcare, education, and customer service use Fishbone Diagrams because the method works for both technical and non-technical people. You don't need a special background to follow along.
How to create a Fishbone Diagram step by step
Building a Fishbone Diagram follows a clear process. You can do it on paper, on a whiteboard, or in a mind-mapping tool — the steps are the same.
1. Identify the problem statement
Start by writing down the problem you want to solve. This goes at the head of the fish on the right side of your diagram.
A strong problem statement is specific. It describes an effect or outcome, not a feeling or a vague concern. Compare these two:
❌ "Customers are unhappy."
✅ "Customers report that shopping bags tear when carried."
The second version gives your team a clear target. Everyone knows what they're analyzing, and you can measure progress later.
If you're not sure how to phrase your problem, try answering three questions: What is happening? Where is it happening? When did it start? Your answers will usually give you a strong first draft.
2. Set up main categories
Next, draw the "bones" — the major branches coming off the spine. These represent the broad categories where causes might live.
The most common framework is called the 6 Ms, which works well for manufacturing and operational issues:
People: training, skills, or human error
Methods: processes, procedures, or workflows
Materials: raw materials, supplies, or inputs
Machines: equipment, tools, or technology
Measurement: data collection, tracking, or analysis
Environment: workspace conditions, regulations, or outside factors
You don't have to use all six. Pick the categories that fit your problem, and add your own if nothing on the standard list fits. The categories are there to prompt thinking from different angles — not to box you in.
3. Brainstorm potential causes
With your categories in place, gather your team and brainstorm causes under each one. The best fishbone diagrams come from people who work with the process every day, so invite them in.
A few tips for this stage:
Welcome every idea: Save the critique for later — you're casting a wide net right now.
Ask "what could cause this?": Repeat the question for each category to keep the conversation focused.
Write each cause as a branch: Keep entries short, like a quick phrase rather than a sentence.
Don't worry if the same cause shows up under more than one category. That overlap often points to something important worth investigating.
4. Expand subcauses
Most causes have causes of their own. For each branch you've added, ask "why does this happen?" and write the answers as smaller branches.
For example, say "equipment malfunction" sits under Machines. The subcauses might include:
Lack of maintenance
Outdated machinery
Incorrect calibration
You can keep going by asking "why" again at each level. This is similar to the 5 Whys technique, which is often paired with Fishbone Diagrams to dig toward root causes.
5. Review and prioritize root causes
Once your diagram is full, step back and look at it as a whole. Not every cause is equally likely or impactful, so the next step is to determine which to investigate first.
A few ways to prioritize:
Look for overlap: causes that appear in more than one category often warrant a closer look.
Focus on causes that, if fixed, would stop the problem from coming back: these are usually the real root causes.
Test your assumptions with data: gather evidence before jumping to a solution.
The diagram itself doesn't fix anything — it tells you where to look next.
From here, your team can run experiments, collect data, and decide which fix is worth the effort.
Common cause categories in a Fishbone Diagram
The 6 Ms work well for many problems, but they're not the only option. You can swap categories in and out to fit your situation.
Two alternatives come up most often:
Process-based categories: if you're analyzing a workflow, use the process steps as your categories. A retail team might use Order, Delivery, Payment, and Follow-up.
Custom categories: some industries need their own labels. A public sector team might use Policy, Procedures, and Place, while a software team might track Code, Infrastructure, and User Input.
Here's a quick comparison:
Standard categories
When to use
People, Methods, Materials, Machines, Measurement, Environment
Manufacturing, product quality, operational issues
Process steps (Order, Delivery, Payment, Follow-up)
Service delivery, customer experience issues
Custom categories
Industry-specific or unusual problems
The goal is to pick categories that help your team think broadly without missing anything important. If a cause doesn't fit your categories, that's a sign to add a new one.
Fishbone Diagram examples in different scenarios
Examples make the method easier to grasp. Here are two scenarios — one about a product, one about a service — that show how a Fishbone Diagram comes together.
Product quality issue example
A grocery store keeps getting complaints that its paper shopping bags tear when customers carry them home. The team builds a Fishbone Diagram to investigate.
The problem statement at the head of the fish: "Customers report that shopping bags tear when carried."
From there, the team maps possible causes across four categories:
Materials: bags are thinner than before, and the supplier has recently changed.
Methods: staff overfill bags and lack training in bagging technique.
Machines: bag dispensers tear bags when pulled.
Environment: Humid storage weakens the paper over time.
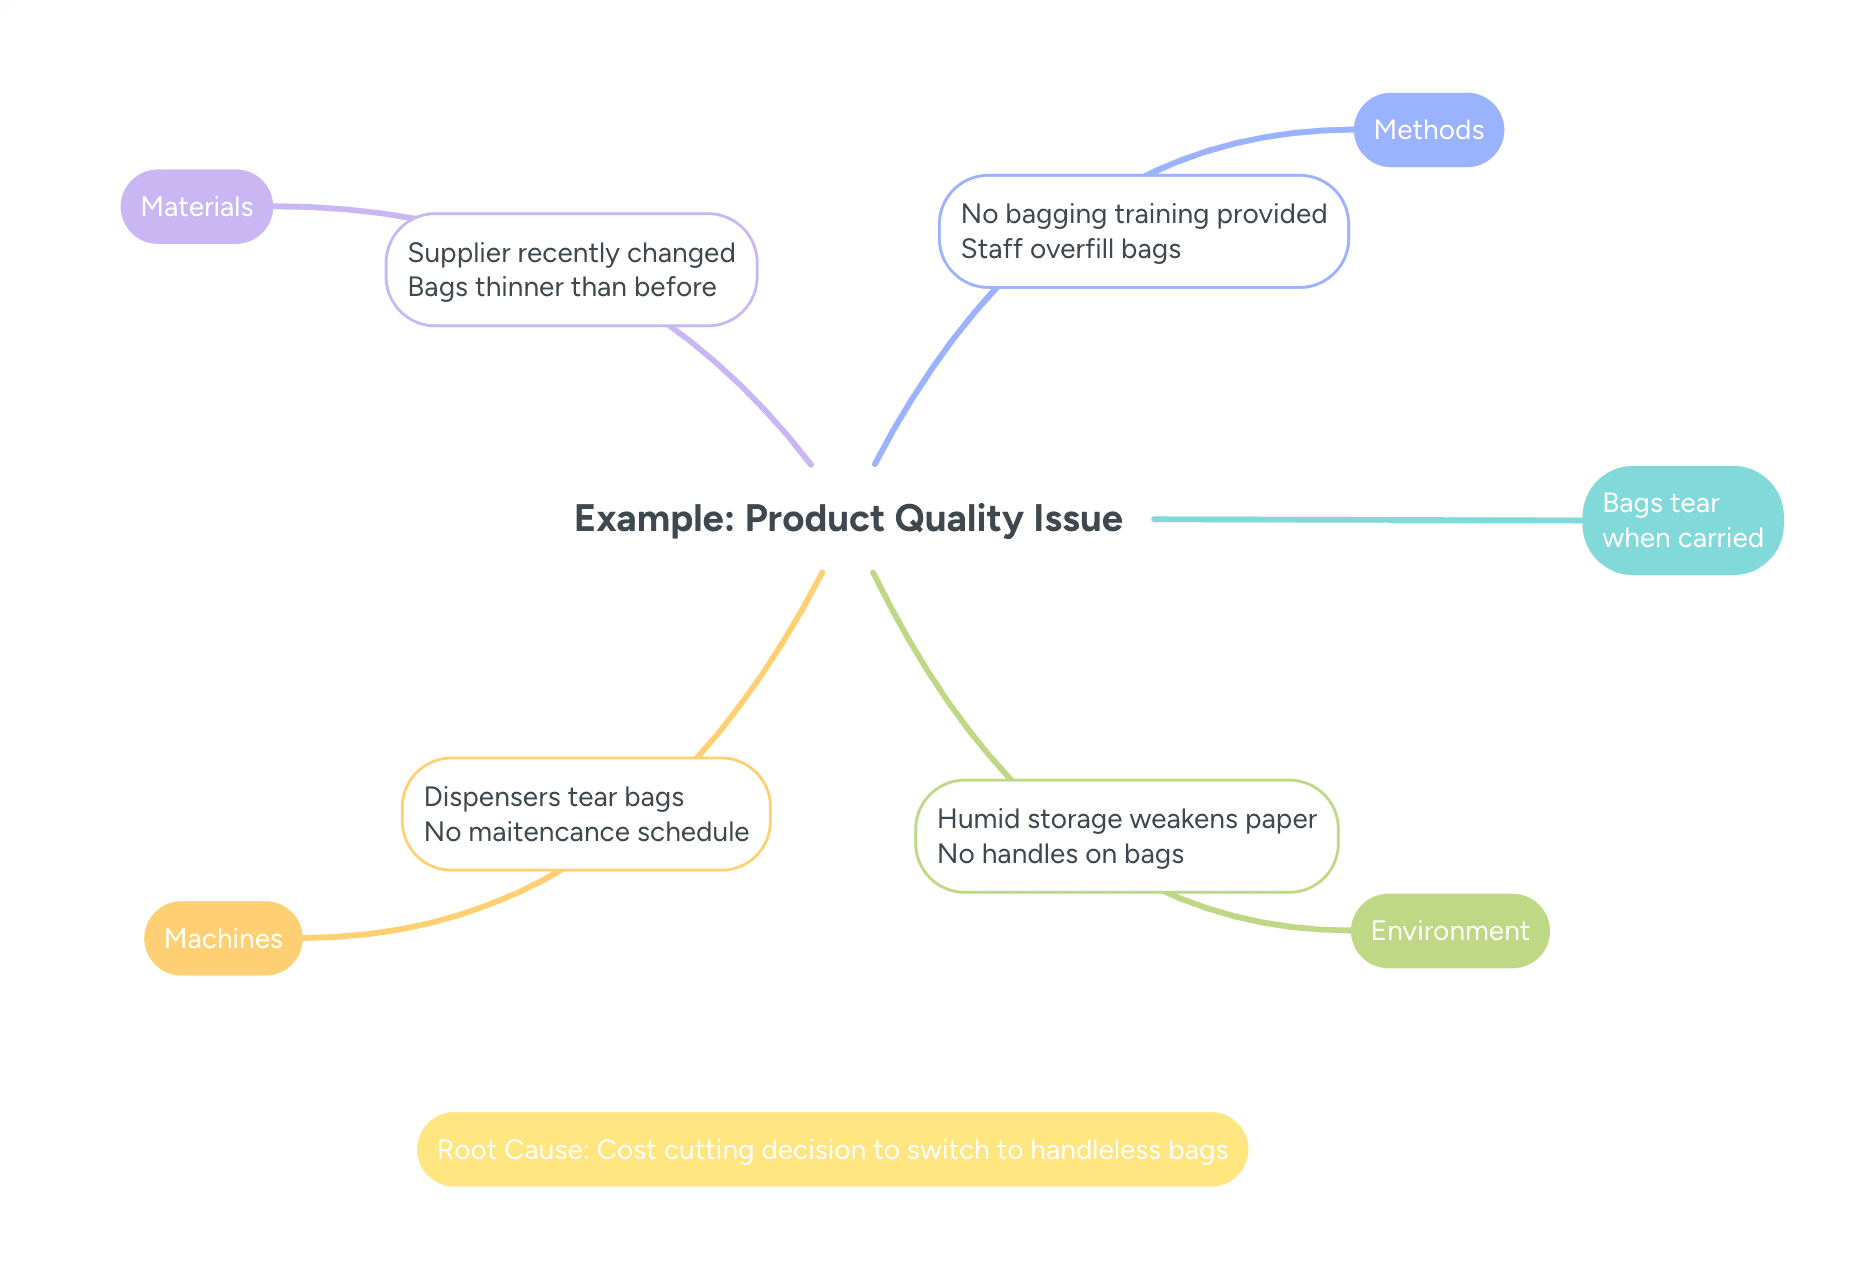
After a closer look, the team finds the store switched to bags without handles to save money. The root cause is a cost-cutting decision that reduced bag durability. Possible fixes include going back to handled bags, training staff on bagging, or offering reusable bags at checkout.
Service delivery issue example
A health clinic notices that patient wait times have climbed over the past three months. The team uses a Fishbone Diagram to identify the reasons.
Problem statement: "Patient wait times have increased by more than 30 minutes on average."
The team maps causes under four categories:
People: staff turnover is high and new hires are still in training.
Methods: the scheduling system allows overbooking with no buffer between appointments.
Measurement: wait time tracking is inconsistent and misses parts of the patient journey.
Environment: patient volume has spiked due to seasonal illness.
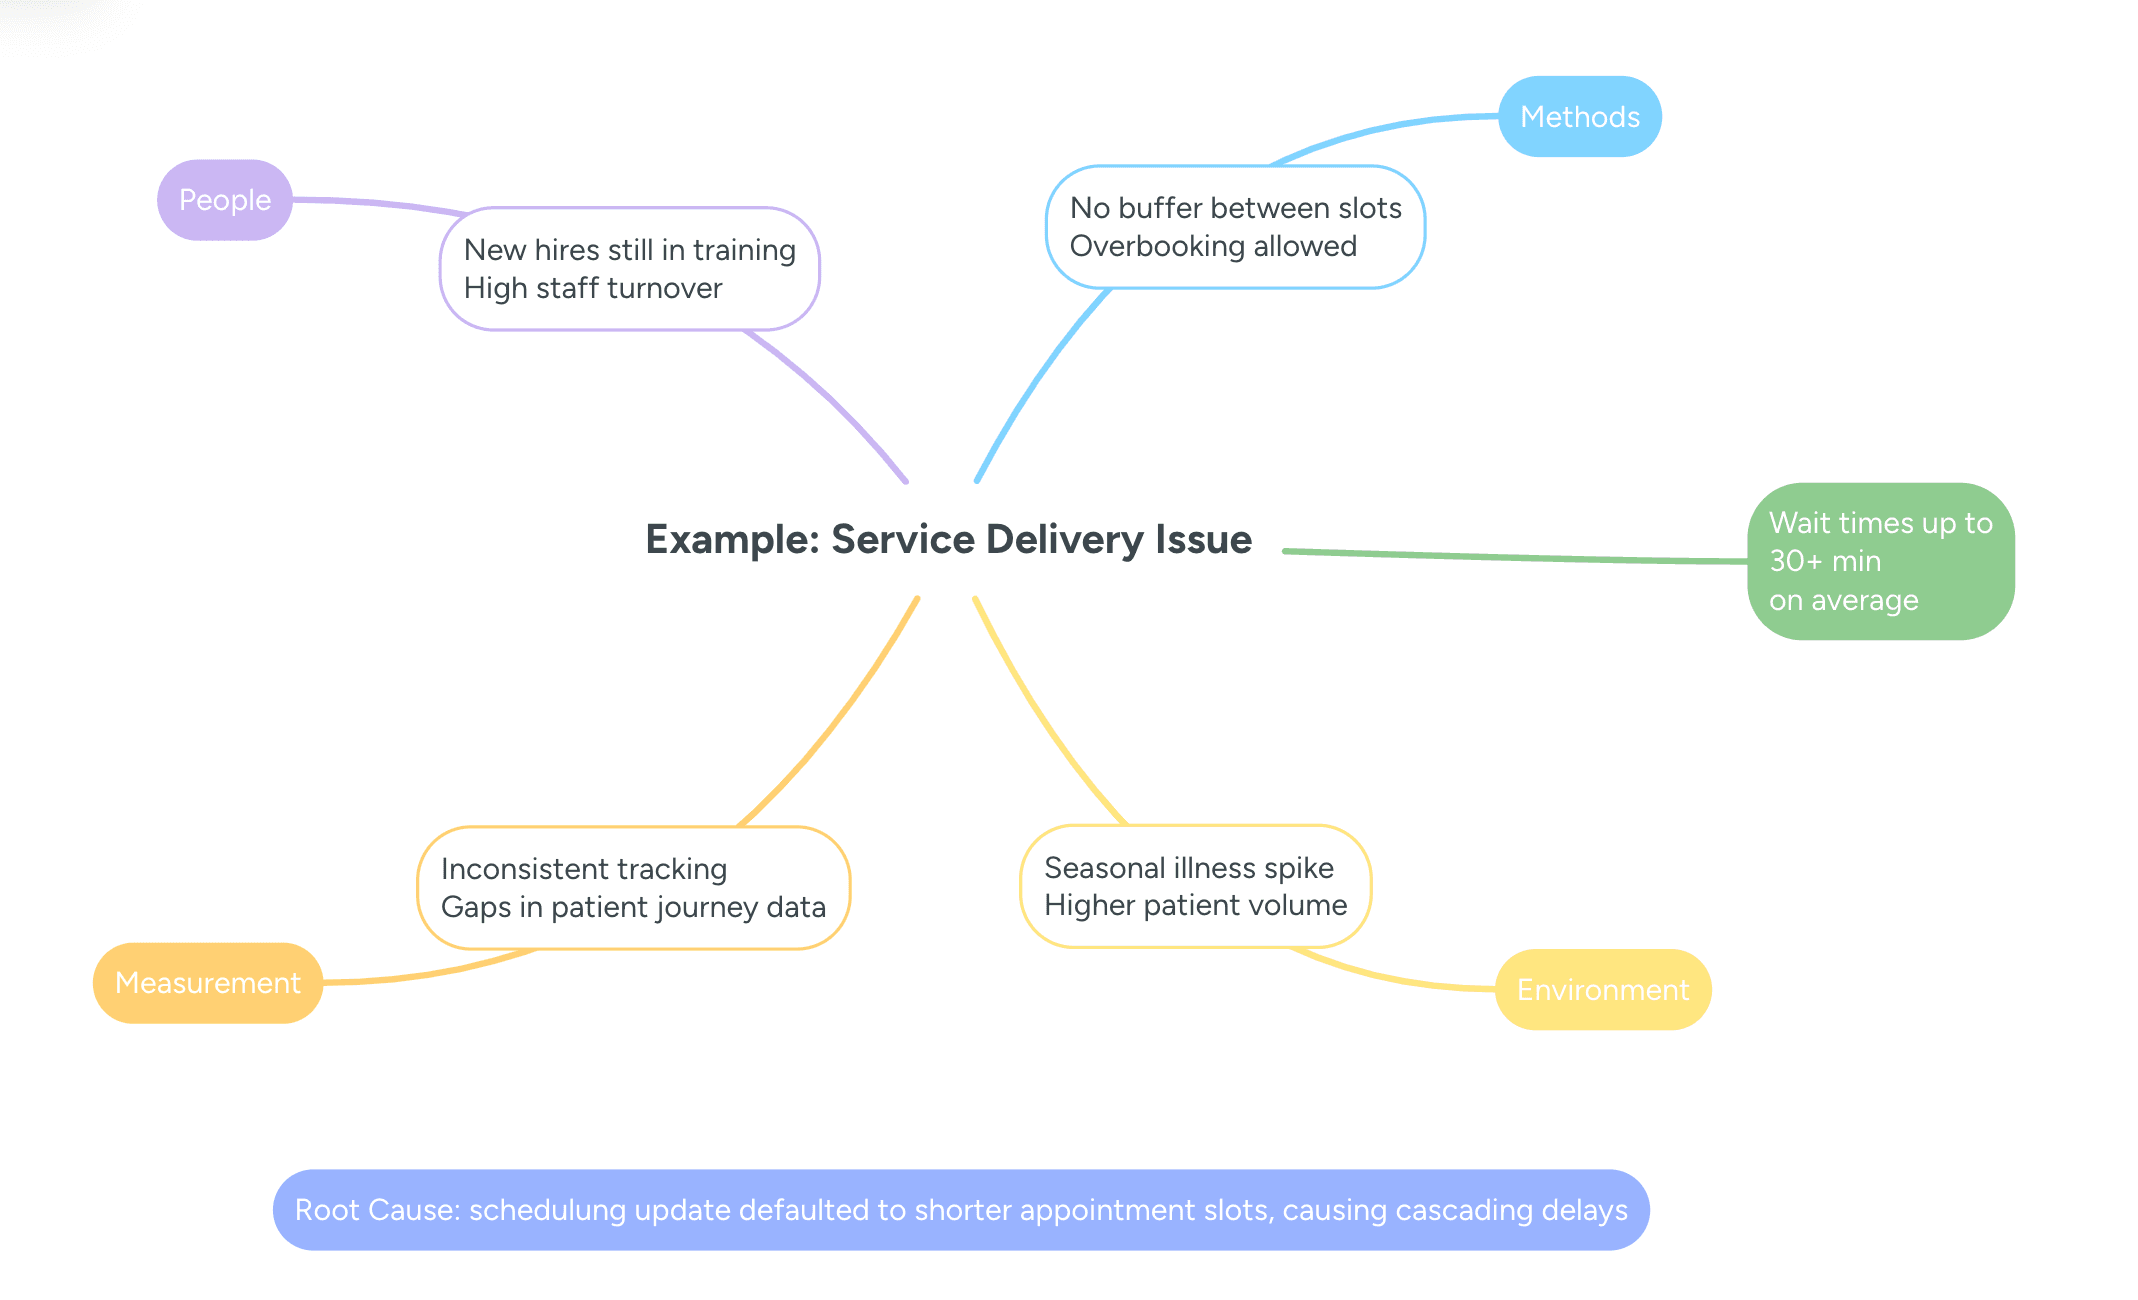
When the team digs into the data, they find that the scheduling software was recently updated and now defaults to shorter appointment slots. Appointments run over, and delays snowball through the day. Fixes might include adjusting default slot lengths, adding buffer time, or staggering appointment types.
Building a Fishbone Diagram in MindMeister
Paper and whiteboards work fine for a quick session, but a digital tool makes the process faster, easier to share, and easier to update. MindMeister's branching structure mirrors the fishbone format, and your team can work on the same diagram in real time from anywhere.
There's also a ready-made Fishbone Diagram template in the MindMeister template library, so you don't have to start from scratch.
1. Open or choose a mind map template
To get started:
Log in to MindMeister or sign up for a free account.
From the dashboard, click "Create New Mind Map" or open the template library.
Search for "Fishbone Diagram" or "root cause analysis."
Select the template to open a pre-built map.
If you'd rather build from scratch, open a blank mind map and add branches manually.
2. Add the main problem statement
The central topic on your map is the "head" of the fish — the problem you're analyzing. Click the central topic to edit it, then type your problem statement. Keep it short and specific, like the examples earlier in the article.
In MindMeister, the central topic sits in the middle of the canvas, with branches fanning out, mirroring the fishbone shape.
3. Branch out categories
Now add the main cause categories as branches from the center. Click the central topic and press Tab (or the "+" icon) to add a new branch, then label it with a category name like People, Methods, or Materials. Repeat for each one you plan to use.
Branches arrange themselves around the central topic automatically, and you can drag them to reposition if you'd like. Color-coding by category makes the diagram much easier to read at a glance — branch colors live in the formatting toolbar.
4. Add subcauses
With your categories in place, add specific causes as sub-branches. Click a category branch, press Tab or the "+" icon, and type the cause as a short phrase. Keep going until each category has the causes your team came up with.
You can drill deeper by adding sub-branches to any subcause, which is helpful when you're asking "why" multiple times. Because MindMeister supports real-time collaboration, your teammates can add causes simultaneously. You can also attach notes or comments to any branch to capture extra context.
5. Review and share your diagram
When the diagram is ready, share it with the people who need to see it. Click the Share button to invite team members or stakeholders, and choose view-only or edit access for each one. You can also export the diagram as a PDF or image for reports and presentations.
Presentation mode lets you walk through the diagram one branch at a time during meetings, which keeps everyone focused on a single category at a time. Come back and update the diagram as your team gathers new information or rules out causes.
Make your next problem-solving session visual
Fishbone Diagrams take messy, abstract problems and turn them into a clear visual you can actually work with. Instead of guessing at causes or jumping to fixes that don't stick, your team gets a shared map of where to look — and where not to.
MindMeister makes that process collaborative. Your team can build the diagram together in real time, attach notes and comments, share it with anyone, and update it as you learn more.
Map root causes with a fishbone diagram

