
What an affinity diagram is and how it works
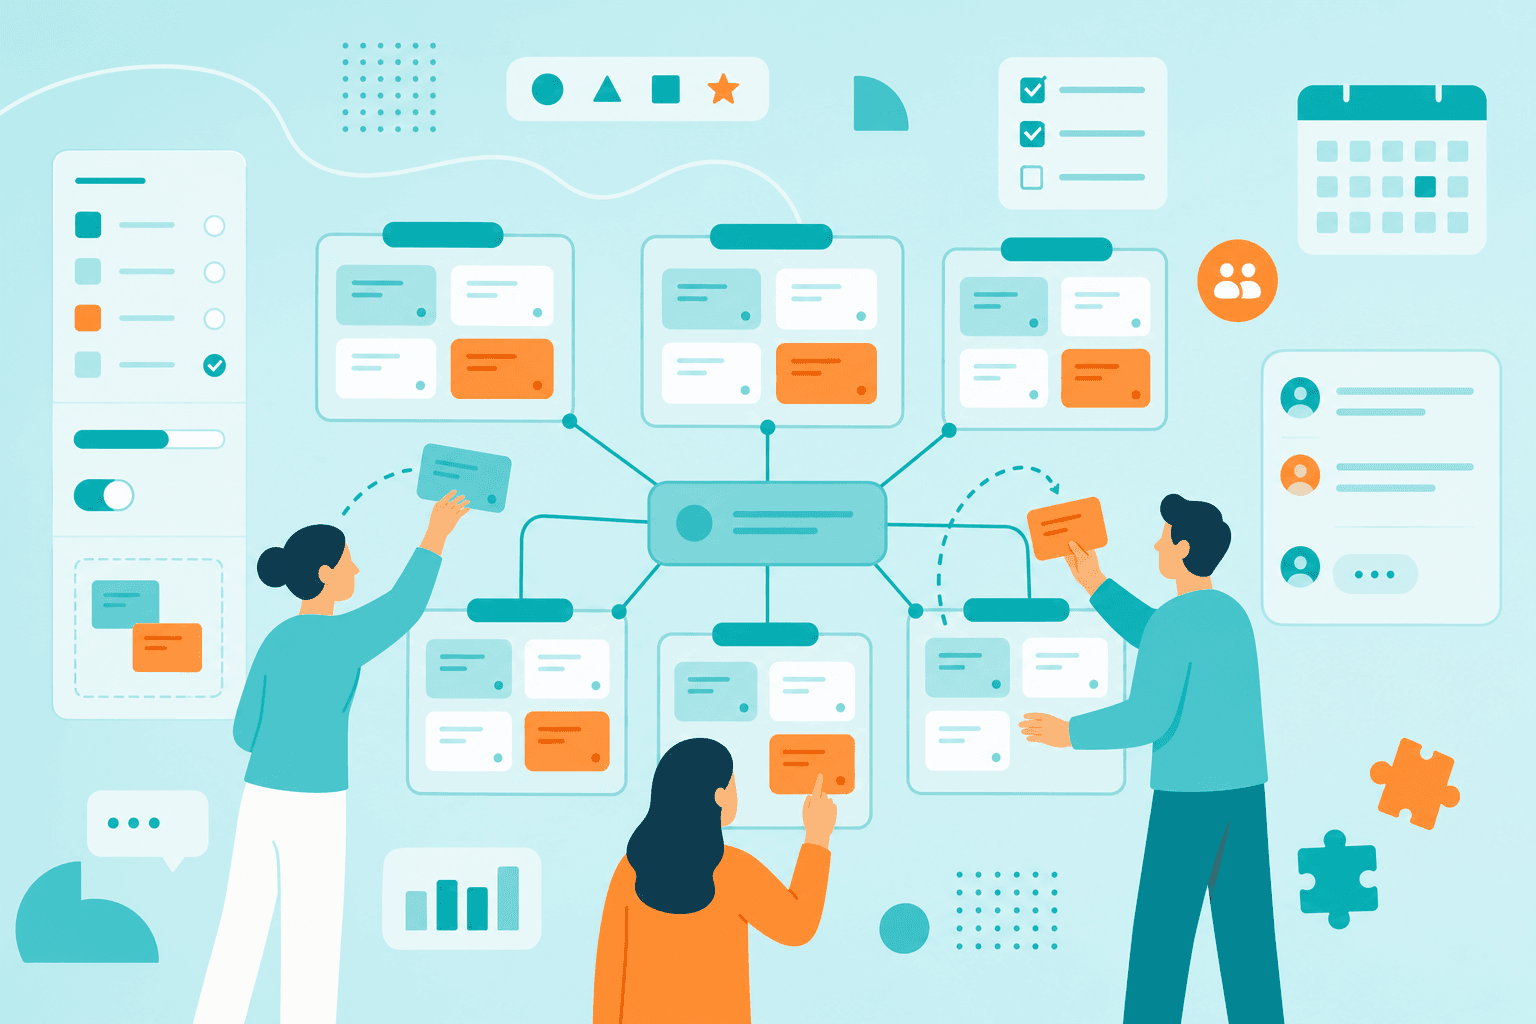
An affinity diagram organizes a large set of ideas, data points, or research findings into themed clusters based on natural relationships. You use it after brainstorming sessions or a research study, not during one. The brainstorm produces the raw material; the affinity diagram structures it into something you can act on. Mixing the two stages tends to reduce the quantity of ideas in the brainstorm and the quality of clusters in the diagram.
The basic structure has 3 levels: a top-level problem or question sits at the center, theme clusters branch out from it, and individual ideas sit within each cluster. Think of it as a hierarchy that emerges from the data rather than one imposed on it. Japanese anthropologist Jiro Kawakita developed the method in the 1960s, which is why it is also called the K-J method. The goal is to let relationships surface naturally rather than forcing ideas into predefined categories before you understand what the data contains.
When to use an affinity diagram
Affinity mapping fits best when you have too many ideas to hold in your head and no obvious structure to impose on them. If you only have 5 items, a numbered list will do. If you have 50, you need a method that reveals connections you would miss by scanning a flat list. A brainstorm might draw on a range of creative thinking techniques, but the output still needs structure. 4 situations stand out.
First, after a brainstorming session that produced dozens of ideas.
Nobody knows which ideas overlap, which contradict each other, or which address the same underlying need. Second, after user research interviews with qualitative findings. Transcripts and notes contain valuable observations, but you need to surface patterns across participants before you can draw conclusions. A single complaint might be an outlier; the same complaint from 5 users is a trend.
Third, when a team needs to reach consensus on priorities. Grouping ideas together forces discussion about what belongs with what, and that discussion often reveals where people agree and where they do not. The act of moving an item to a cluster makes implicit opinions explicit. Fourth, when a complex problem needs to be broken into manageable themes. Clustering related issues helps a team see which areas are largest and which deserve attention first. A problem that feels overwhelming as a single mass becomes approachable when split into 5 or 6 distinct categories.
3 common use cases follow from these situations: UX research synthesis, team retrospectives, and product feature prioritization. Each requires a different central question and different cluster themes, but the underlying method stays the same. The next section develops each of them with worked examples.
How to create an affinity diagram in MindMeister
The process has 4 steps. Each one builds on the last, moving from raw ideas to organized themes. You can run through them in 30 minutes for a small dataset or spread them across multiple sessions for a larger research synthesis.
1. Place the core problem or research question in the central node
Open a blank MindMeister map and type your core problem or research question into the central node. This anchors the entire diagram and gives every subsequent branch a clear reference point. If you are synthesizing user research, the central node might be your research question: "What frustrates users about onboarding?" If you are prioritizing features, it might be the product goal: "Launch the mobile app by Q3." Everything else branches out from here, and the phrasing of the central node shapes how you group what follows.
2. Add every idea as a sub-branch under an unsorted main branch
Create a main branch called "Unsorted" and add every idea, finding, or data point as a sub-branch under it. Do not filter or judge at this stage. The goal is capture, not evaluation. If you ran a brainstorm, add every sticky note. If you completed a research study, add every observation or quote that matters. Resist the urge to skip items that seem minor or redundant; patterns often emerge from the details you would otherwise discard.
Real-time collaboration in MindMeister lets multiple team members add ideas at the same time, which speeds up this step for remote and in-person teams alike. Everyone sees the same map updating live, so there is no need to consolidate separate lists afterward.
3. Group related ideas into themed clusters
Create new main branches for emerging themes. Drag ideas from the unsorted branch into the cluster where they fit best. As you move items, patterns will surface: several ideas about onboarding, several about pricing, several about a specific user frustration. Name each new branch with a placeholder label for now, something like "Onboarding issues" or "Pricing feedback." Focus on grouping first, naming second.
If your team is working together in MindMeister, this step often sparks discussion. Someone drags an idea to one cluster; someone else argues it belongs elsewhere. That friction is valuable because it surfaces assumptions about what the data means.
4. Name each cluster and review the structure
Return to each cluster branch and give it a name that reflects the common thread running through its sub-branches. A good cluster name summarizes what the grouped ideas share without being so broad that anything could fit. Read through the ideas in each cluster to confirm they belong together. Some ideas may fit in more than 1 cluster, in which case you can duplicate them or place them in the cluster where they add the most value. Other ideas may not fit anywhere and deserve their own branch. A few outliers are normal; they sometimes point to themes that are underrepresented in your data.
Once the structure feels stable, review the diagram with your team. The branching layout in MindMeister lets you collapse and expand clusters, which helps when presenting the final groupings to stakeholders. The same clusters can feed into related exercises like stakeholder mapping when you need to plan who to involve next.
UX research example. After a round of user interviews, the central node holds the research question, such as "What do users struggle with during checkout?" Main branches become theme clusters: user pain points, user needs, and observed behaviors. Sub-branches contain individual quotes and observations from participants. Affinity diagramming is a common step in the design thinking process, and grouping the raw notes into these clusters reveals which pain points appear most often and which needs are shared across user types. When 6 of 8 participants mention confusion about shipping costs, that cluster grows visibly larger than others, making the pattern hard to ignore.
Team retrospective example. At the end of a sprint, the central node holds the sprint name or iteration number. Main branches split into what worked, what did not work, and what to change. Sub-branches contain individual observations from team members. Moving observations into these clusters turns a scattered debrief into an organized list of actions, and a large "what did not work" cluster can lead into a deeper root cause analysis of what went wrong. The visual layout also makes it clear when 1 cluster dominates the conversation; if the "what did not work" branch is twice the size of the others, the team knows where to focus.
Product prioritization example. When planning a roadmap, the central node holds the product goal, such as "Improve retention for free users." Main branches become must-have features, nice-to-have features, and out of scope. Sub-branches contain individual feature ideas. Sorting ideas into these clusters helps a team see which features align with the goal and which can wait. When stakeholders disagree on priorities, having all options visible in 1 map makes it easier to compare trade-offs and reach consensus.
Affinity diagram vs mind map: the key difference
A mind map starts from a central idea and radiates outward. You begin with a topic and explore it, generating new branches as you think. The movement is generative: you are expanding from a single point into new territory. You might not know where the branches will lead when you start.
An affinity diagram moves in the opposite direction. You start with a large set of existing ideas and group them inward into clusters. The movement is organizational: you are compressing many items into a smaller number of themes.
MindMeister supports both modes because the branching structure works for both purposes. You can use a blank map to brainstorm outward, then switch to affinity grouping to organize what you generated. A team might spend 20 minutes adding ideas radiating from a central challenge, then spend another 30 minutes dragging those ideas into themed clusters. The difference is in how you use the tool, not the tool itself.
Turn your next brainstorm into a plan
Brainstorming fills the room with ideas.
The method stays the same whether you are synthesizing research, closing out a sprint, or prioritizing features: capture everything, group by relationship, and name the clusters that emerge. What changes is the central question and the labels on your branches.
Open a blank MindMeister map, place your core problem or research question in the central node, and follow the steps above. Within an hour, you can have a structured diagram showing which themes emerged and where to focus next.
Turn brainstorms into action plans