
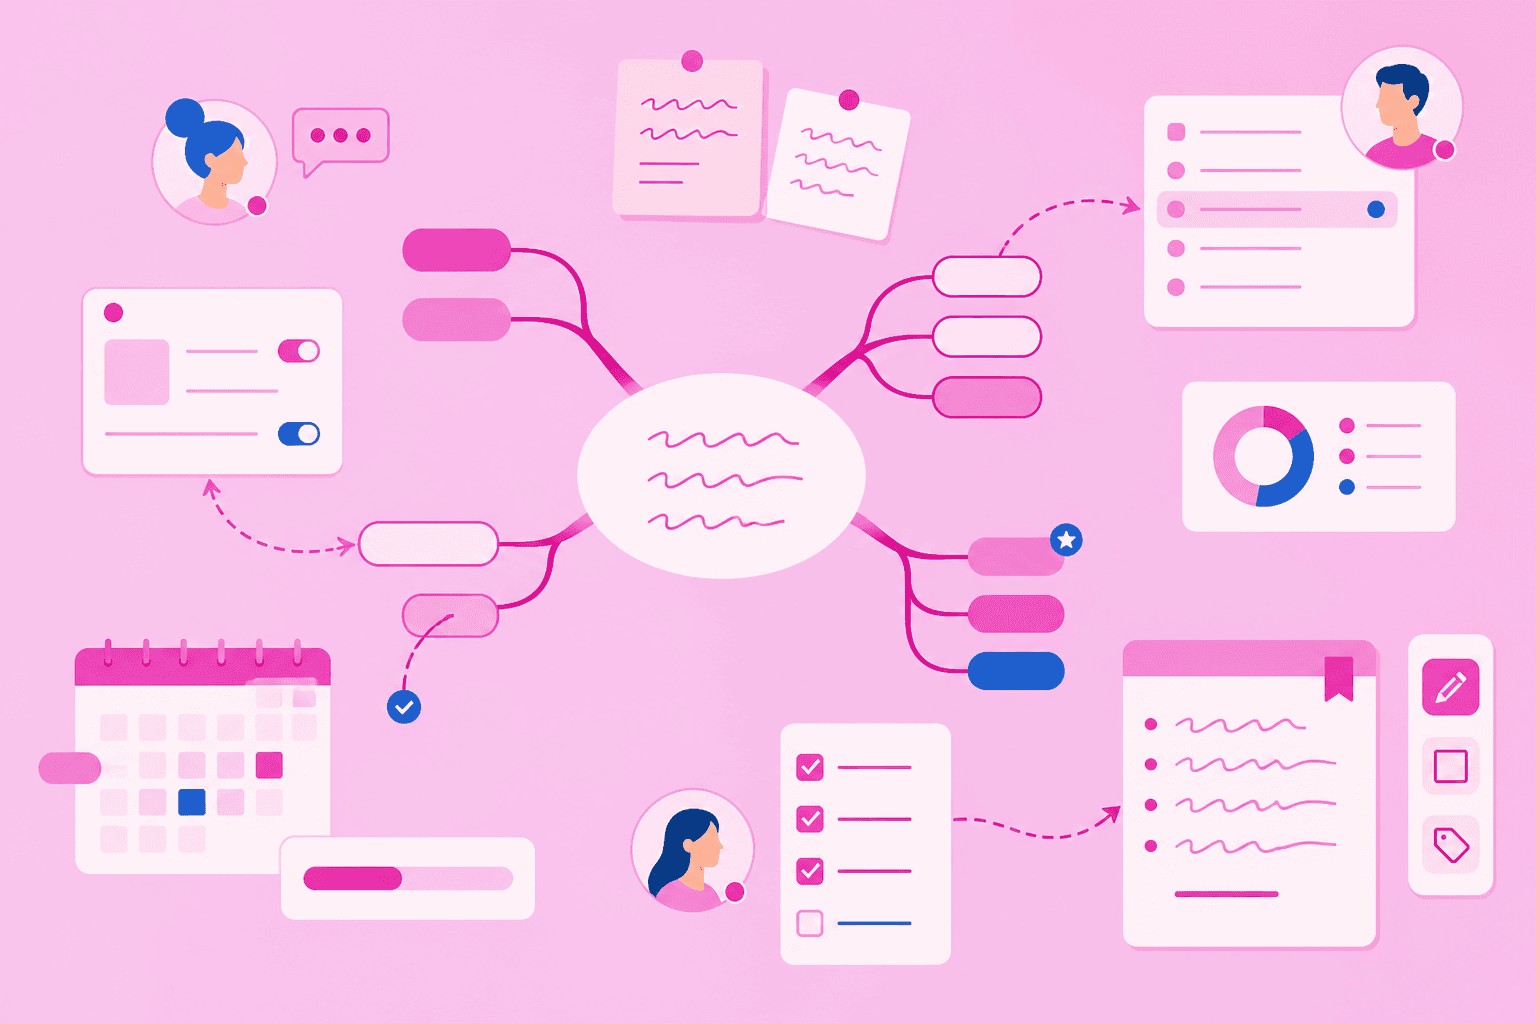

What a visual learner is
Visual learning is a preference for processing information through images, diagrams, spatial organization, and visual structure rather than text or audio alone. If you tend to sketch ideas on a whiteboard, prefer flowcharts to bullet lists, or remember faces better than names, you likely lean toward visual processing. This is a cognitive strength: a way your brain naturally handles information, not a personality label or a fixed category you are locked into.
The idea that matching teaching style to a fixed individual learning style dramatically improves outcomes is contested. Matching instruction to a fixed individual learning style does not reliably improve outcomes; the evidence is too weak and inconsistent to justify it. A 2024 meta-analysis of learning-styles research found only a small and inconsistent effect, too modest to support building a curriculum around it. What is well-evidenced is different: pairing relevant visuals with words generally improves learning and memory for most people, not only those who identify as visual learners. Research on multimedia learning shows that people learn better from words and pictures together than from words alone, because images and text are processed through separate channels and reinforce each other (this is what psychologists call dual coding).
So while labeling yourself a "visual learner" does not mean you can only learn visually, recognizing that you process information better with visuals is still useful. It points you toward strategies that play to your strengths. Four characteristics tend to show up in people who prefer visual processing:
Think in pictures: You naturally translate ideas into mental images, diagrams, or spatial layouts.
Prefer diagrams and charts over text: Dense paragraphs feel harder to absorb than a well-organized chart or map.
Strong spatial memory: You remember where information appeared on a page or screen better than the exact wording.
Difficulty with purely verbal or text-heavy instruction: Lectures without slides or books without diagrams leave you working harder to retain details.
Recognizing these patterns is a starting point. The next step is choosing strategies that turn visual preference into a practical advantage.
Four visual learning strategies that work
The strategies below are not magic fixes: they require effort and repetition like any study method. What they share is a reliance on spatial structure, imagery, and visual organization that tends to suit people who process information visually.
1. Mind mapping
Mind mapping starts with a central idea and radiates outward in branches that capture subtopics, details, and relationships. Unlike a linear outline, a mind map lets you see the entire topic at a glance: hierarchies, clusters, and connections are all visible on a single canvas.
For visual thinkers, this format mirrors the way ideas already sit in your head: associative and spatial rather than strictly sequential. Building a map forces you to decide what connects to what, which sharpens your understanding. You might place "causes of a conflict" on one branch and "effects" on another, then see at once how the two relate, something a numbered list can hide.
Choosing where to place a concept, drawing a connection, and labeling a branch all require you to engage with the material. You are not just recording information; you are organizing it.
Mind mapping tools make this process fast. You add a node, link it to a parent, and the structure updates automatically. Color coding branches by category — red for key events, blue for figures, green for consequences — adds another layer of visual distinction that aids recall.
2. Color coding and visual organization
Color coding assigns meaning to color: red for urgent, blue for definitions, and yellow for examples. When you open a page of notes later, the color signals what you are looking at before you read a single word.
This works for visual thinkers because color triggers pattern recognition and reduces the cognitive work of scanning. Color acts as a fast visual filter; your eyes catch a red highlight before you consciously read the words around it.
A concrete approach: highlight key terms in one color, supporting evidence in a second color, and your own questions in a third. When you revise, those layers stand out. The same principle applies to digital notes, flashcards, and slides. Consistency is more important than the specific colors you choose. Pick a system that makes sense to you, use it across all your materials, and let color do the sorting work your eyes do naturally.
3. Diagram and flowchart creation
Diagrams externalize the process. A flowchart turns an abstract sequence — like decision-making in an algorithm or stages in a scientific cycle — into boxes and arrows you can trace with your eyes.
For visual learners, this concreteness matters. When you draw a cycle diagram of photosynthesis or a decision tree for troubleshooting, you have to work out the order and the logic, not just read about it. The diagram then becomes a mental anchor: in an exam, you recall the shape and walk through the steps from memory.
Flowcharts are especially useful for anything with branching conditions or cause-and-effect chains. Start with the first action, add decision points, and connect outcomes. The structure will expose gaps in your understanding that you might otherwise miss.
Even a rough sketch on paper works. The goal is not artistic polish; it is the act of translating abstract steps into visible positions. Once the process lives on the page, you can trace paths, compare branches, and identify where logic breaks down.
4. Visual note taking
Visual note taking replaces linear lines of text with spatial layouts, sketches, icons and connecting lines. Instead of writing lecture notes top-to-bottom, you arrange ideas on the page. Clustering related points, drawing arrows between concepts, and leaving white space to add details later.
This approach forces active processing. You cannot passively transcribe; you have to decide how ideas relate and where to place them. That decision-making strengthens memory. Compare this with methods like the Cornell note taking method, which keeps structure but remains largely linear. Active recall techniques test memory after the fact. Visual note taking does some of the connecting work during the initial capture — you engage with relationships as you record them.
A visual mapping tool works well for this approach. Open a blank map, drop in ideas as they arise and drag branches to reposition them as the picture clarifies. By the end of a meeting or lecture, you have a spatial record that is faster to review than a wall of text.
How mind mapping helps visual learners specifically
MindMeister gives visual thinkers a canvas that matches the way they already organize information. Here are 3 of the benefits of mind mapping that matter most for visual learners:
Spatial organization. Ideas sit in space rather than in a top-to-bottom list. You choose where to place a concept — to the left, radiating below, clustered with related points — and that location becomes part of how you remember it. For visual thinkers, position turns into a memory cue: you recall roughly where an idea sat on the map, which helps you retrieve it later.
Visible connections. Branches show relationships. When you link "economic downturn" to both "unemployment" and "government response," the cause-and-effect chain is visible rather than implied. Visual thinkers do not have to hold these links in working memory; they can see them. This externalization reduces cognitive load and makes complex webs of information easier to review.
Flexible structure. A mind map grows and changes as your understanding develops. You can add a branch when new information appears, move a topic from one section to another, or collapse sections you do not need at the moment. This flexibility mirrors the iterative way learning actually works; seldom is a subject fully understood on the first pass. Unlike a static document, a map invites revision. You refine as you learn, and the structure reflects your current understanding rather than your first draft.
Consider a visual learner revising for a history exam. A linear set of notes lists events in chronological order: revolution, treaty, economic crisis, and political shift. The dates are there, but the connections are buried in the prose. In a mind map, the same learner places "revolution" at the center, then branches outward to causes (taxation, famine, ideology) and effects (new government, economic reform, foreign response). Each branch can link to others — taxation connects to economic crisis, economic crisis connects to political shift. The cause-and-effect structure appears at a glance, and the learner can trace any chain without scrolling through pages.
Real-time collaboration adds a layer for group study. Classmates can add to the same map simultaneously, each seeing what others contribute, no waiting for someone to share a document. Whether you revise alone or with a group, MindMeister keeps the map accessible on desktop, web, or mobile.
Visual learning in practice: three starting points
Knowing how visual learning works is only useful if you apply it. Here are 3 starting points for different contexts:
Students: build a visual revision map for an upcoming exam. Choose a topic, place the central concept in the middle, and branch out to sub-topics, key terms, and examples. Use color to distinguish categories. Spend 20 minutes mapping before you review your notes; the act of building the structure is itself a form of study.
Professionals: capture your next meeting as a visual map instead of linear bullet points. Put the meeting goal in the center, branch to agenda items, and add action items as they arise. At the end, you have a record that shows not just what was discussed but how topics connected and who owns each next step. When you return to the map weeks later, the spatial layout helps you recall the context faster than scrolling through text does.
Anyone learning something new: map a topic before reading about it to activate prior knowledge. Write the subject in the center and add everything you already know: partial facts, questions, and related ideas. Then read or watch the source material and expand the map. Connecting new information to what you already know deepens retention.
Open a blank MindMeister map and try the visual note taking approach described earlier
Visual learning is not about labels. It is about using strategies that align with how your brain naturally processes information. When you turn text into spatial structure, abstract ideas into visible connections, and passive reading into active mapping, you work with your strengths instead of against them. Start with one strategy, see what sticks, and build from there.
Turn ideas into visual maps that stick